

Following on the heels of our PostgreSQL Tuples Statistics Dashboard, here’s another blog post describing how you can gain additional visibility of PostgreSQL queries using PMM. We take a look at using an extension called pg_stat_statements. This allows us to collect information about the various queries running in your PostgreSQL instance. We’ll describe how to check if you already have pg_stat_statements running, and if not how to enable the extension in PostgreSQL. Finally, we’ll see how to enable collection using a custom query file and pmm-admin option flag.
We have taken much of our inspiration for these new PG dashboards from Gregory Stark’s presentation at PGConf.eu in 2018, where he demonstrated some excellent work using Grafana and Prometheus to build a PostgreSQL monitoring solution.
PMM (Percona Monitoring and Management) is a free and open-source platform for managing and monitoring MySQL®, MongoDB®, and PostgreSQL performance. You can run PMM in your own environment for maximum security and reliability. It provides thorough time-based analysis for MySQL, MongoDB, and PostgreSQL servers to ensure that your data works as efficiently as possible.
Setting up query monitoring in PMM for postgres
Postgres extensions, in simplified terms, are lower level APIs that exist within PostgreSQL that allow to change or extend its functionality. The extension pg_stat_statements is known as a contrib extension, found in the contrib directory of a PostgreSQL distribution.
So let’s check if this extension is in your database installation.
1 2 3 4 5 | postgres=# SELECT * FROM pg_available_extensions WHERE name = 'pg_stat_statements'; name | default_version | installed_version | comment --------------------+-----------------+-------------------+----------------------------------------------------------- pg_stat_statements | 1.6 | | track execution statistics of all SQL statements executed (1 row) |
If no installed version is provided please enable the extension.
1 2 3 4 5 6 7 8 | postgres=# CREATE EXTENSION pg_stat_statements; CREATE EXTENSION postgres=# SELECT * FROM pg_available_extensions WHERE name = 'pg_stat_statements'; name | default_version | installed_version | comment --------------------+-----------------+-------------------+----------------------------------------------------------- pg_stat_statements | 1.6 | 1.6 | track execution statistics of all SQL statements executed (1 row) |
The next step is to teach our exporter to collect information from the extension. So we need create a file with a custom query or you may use the already created file in our exporter repository.
Now lets run the exporter with this file /home/ec2-user/queries.yaml. Please use flag extend.query-path as in the example below.
1 2 3 4 5 | [root@ip-10-178-1-82 ec2-user]# pmm-admin rm postgresql:metrics PS_NODE-1 OK, removed PostgreSQL metrics PS_NODE-1 from monitoring. [root@ip-10-178-1-82 ec2-user]# pmm-admin add postgresql:metrics --user postgres PS_NODE-1 -- --extend.query-path /home/ec2-user/queries.yaml OK, now monitoring PostgreSQL metrics using DSN postgresql:***@/postgres |
So now you can upload two dashboards in order to checks queries through the PMM interface.
Here are some screenshots from our test installation.
This is the first of the dashboards “PostgreSQL Queries Overview” that shows information about all queries and databases.
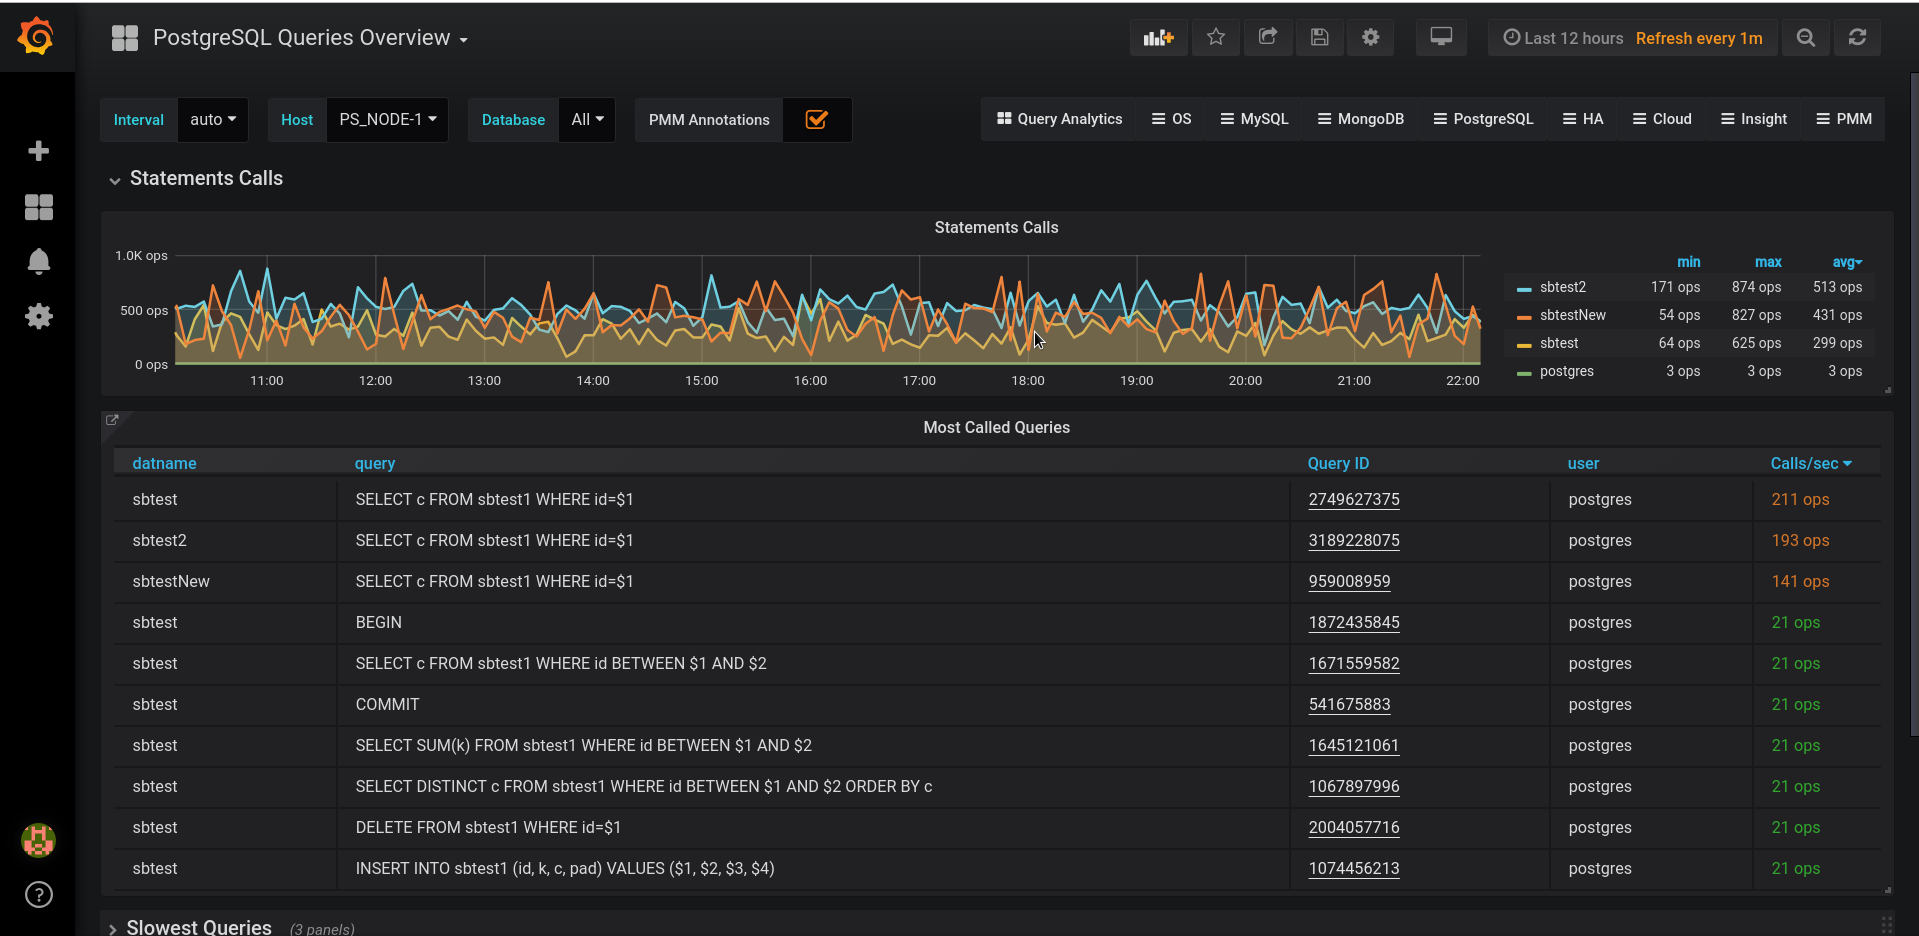
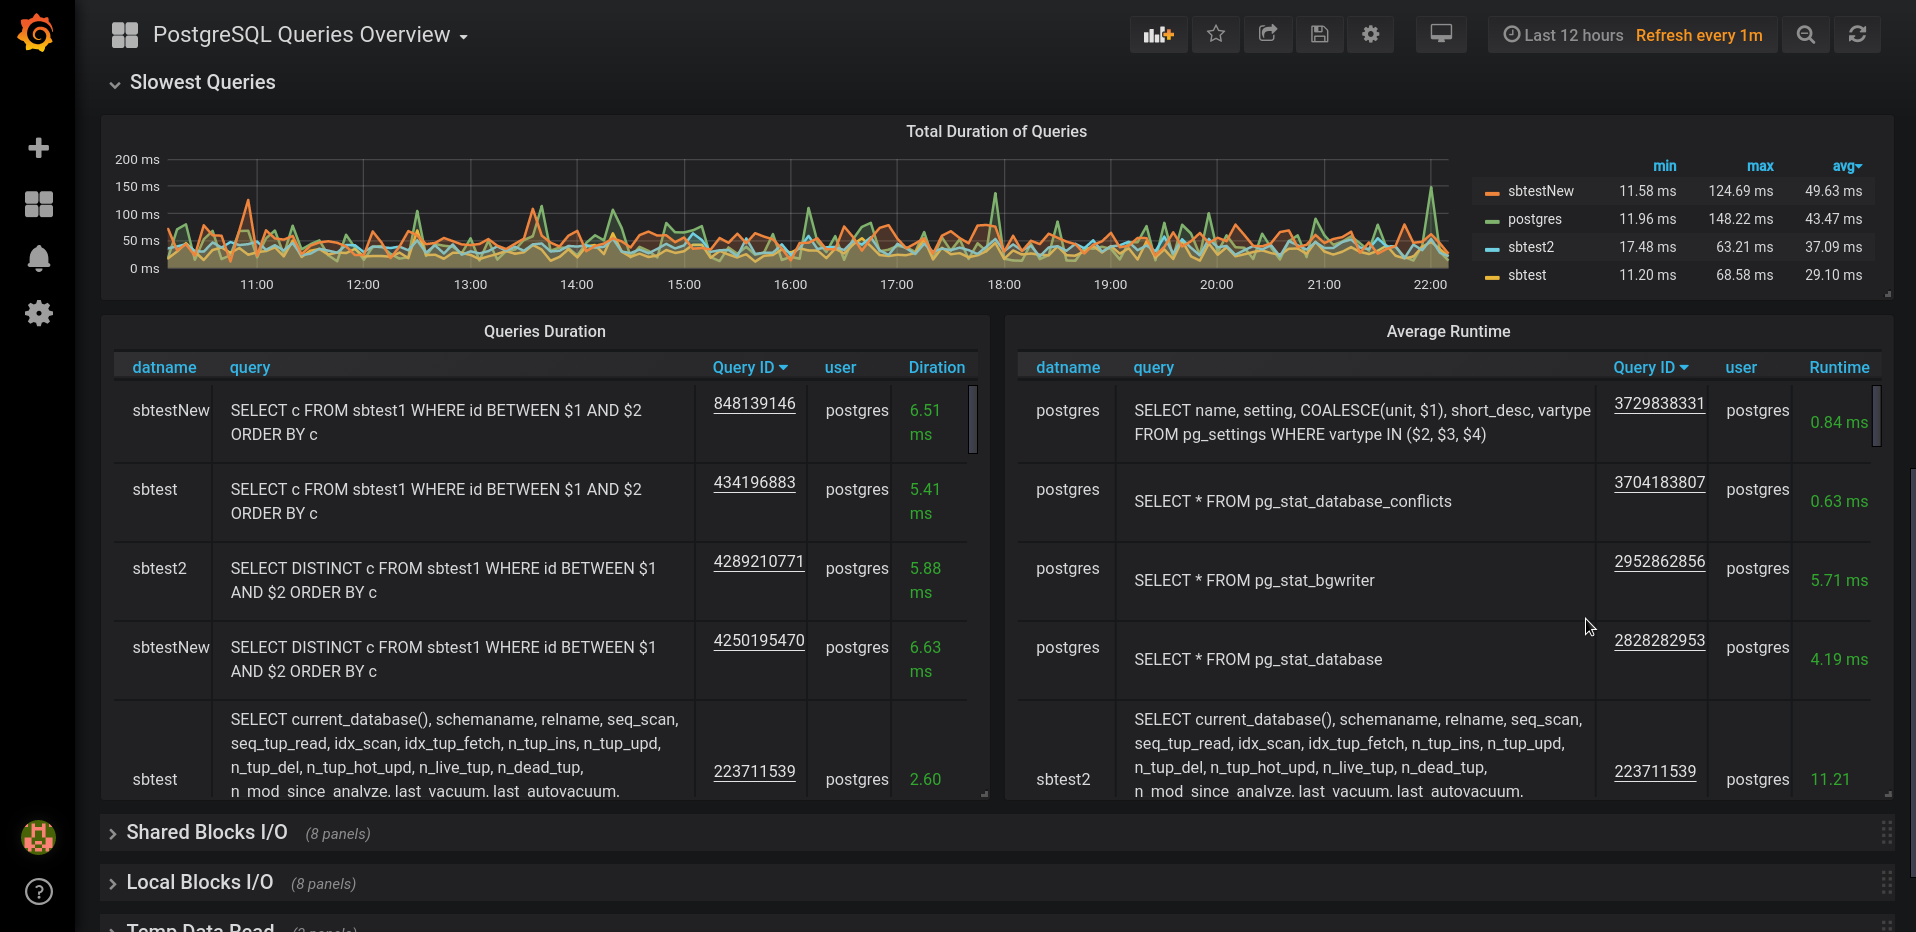
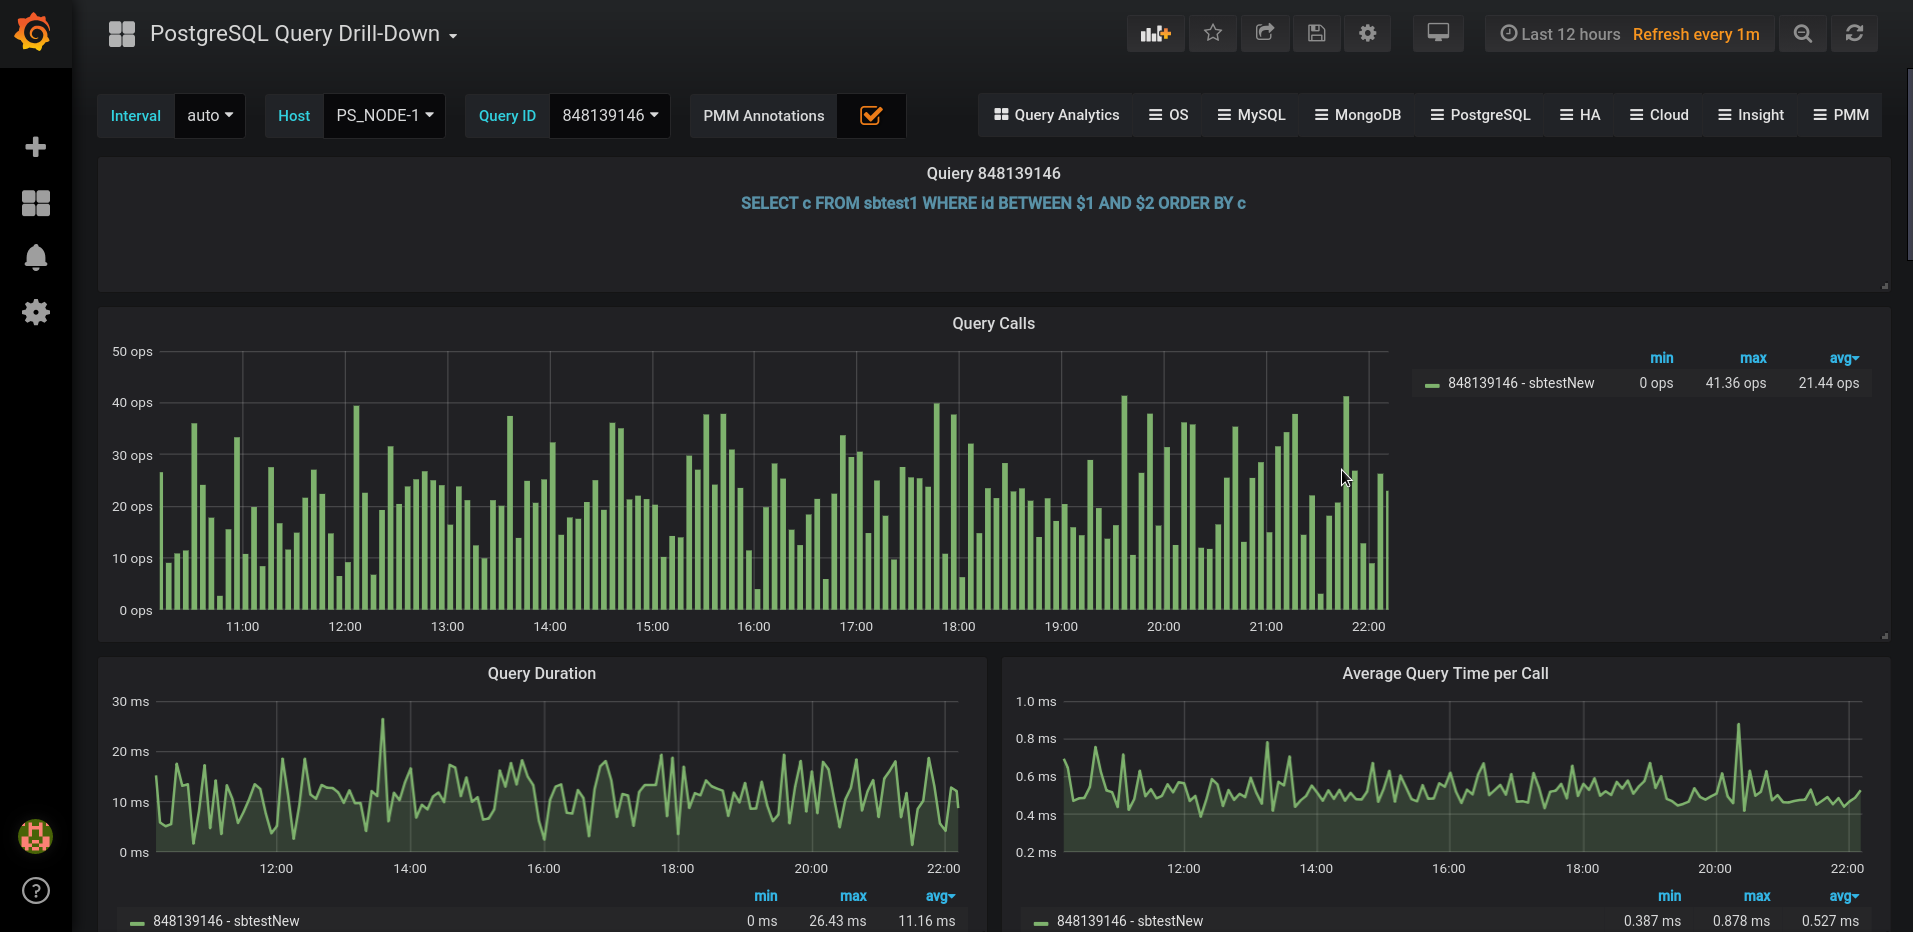
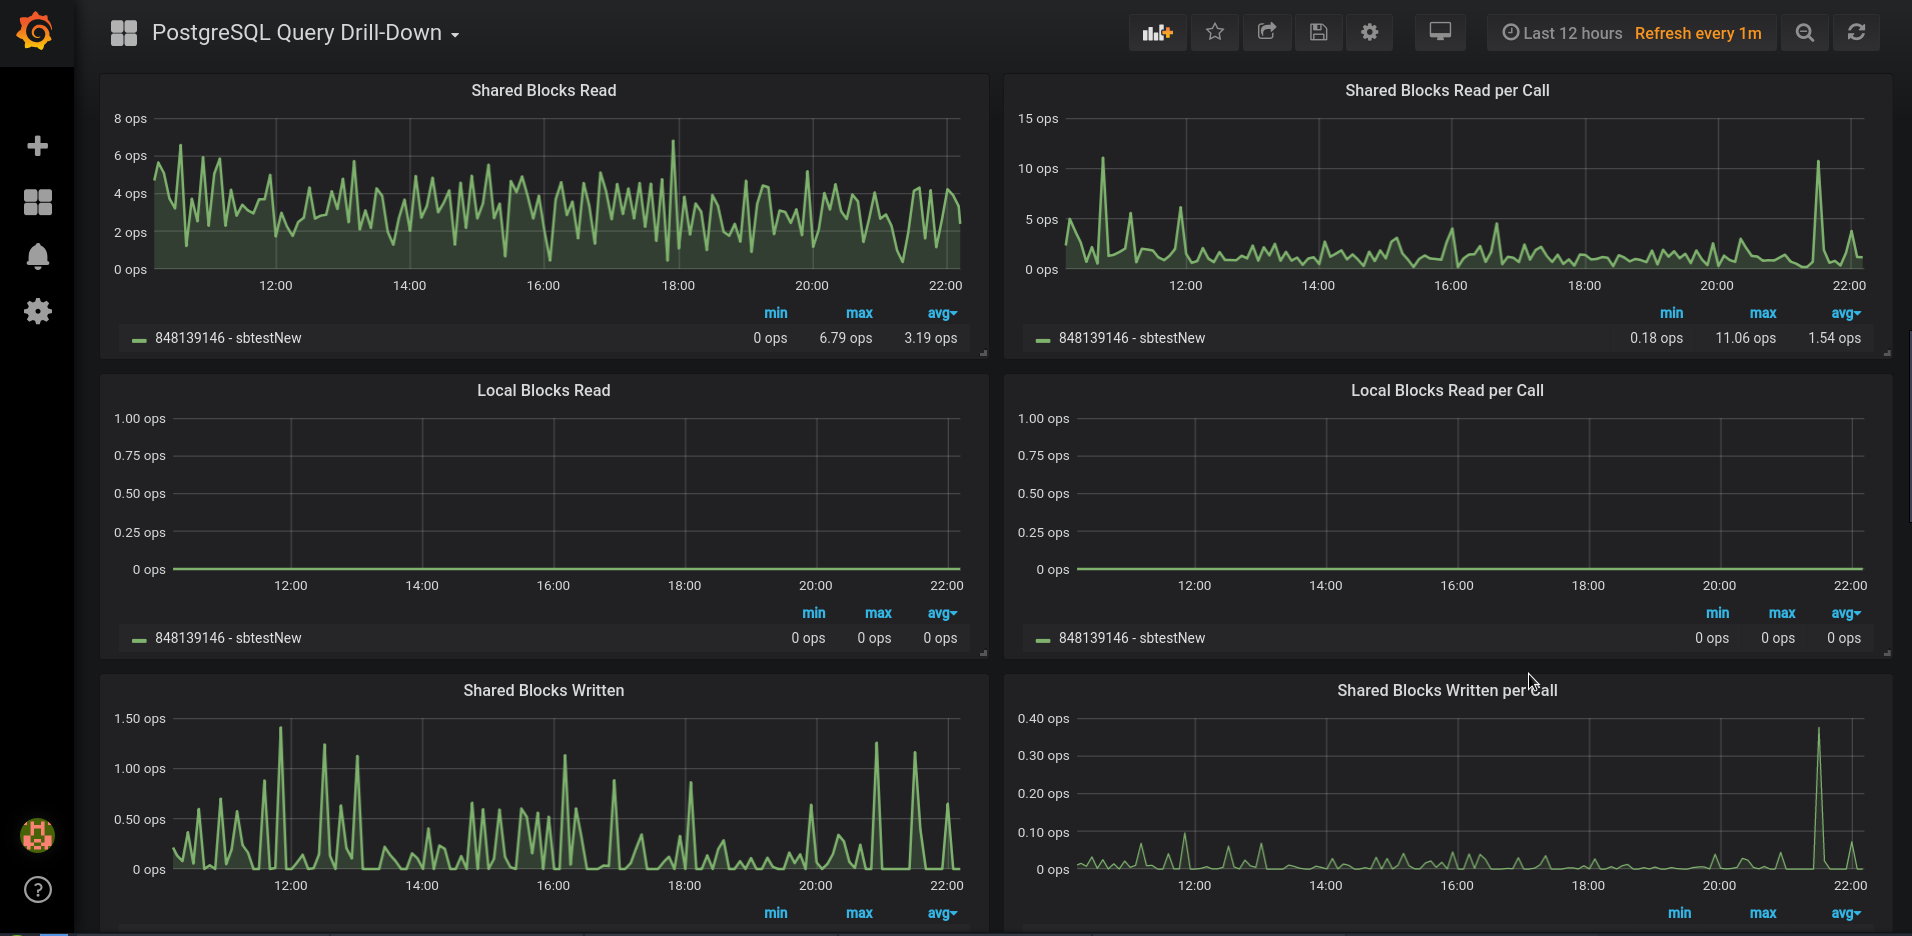
Please notice that the query id is clickable and leads to the second dashboard “PostgreSQL Query Drill-Down”. So you can check charts related to a selected query.
Both dashboards are available in GrafanaLab and have been adapted for PMM.


which port number should be opened on firewall?
if mysql are 42002 and 42000, then what about postgre?
It’s 42005.
Hi Vadim, Yalovets, I have pg_stat_statements version 1.3 installed.. should it work ?
I actually installed and when i ran postgres_exporter with –extend.query-path its still throwing error
INFO[0173] Error running query on database “localhost:5432”: pg_stat_statements pq: relation “pg_stat_statements” does not exist source=”postgres_exporter.go:1286″
The default TCP port for PostgreSQL is usually 5432. It can be checked in the file postgresql.conf
e.g.
# grep “port = ” /etc/postgresql/10/main/postgresql.conf
port = 5432 # (change requires restart)
i have done the setup as instructed above i could see dashboard but with no datapoints i have used the below commands with extend querypath with the yaml file provided above but still getting the no datapoints can you throw some light on this
pmm-admin list doesnt show the options value does it have anything to do with missing data points
[~]# pmm-admin add postgresql:metrics –host=localhost –password=yyy –port=5432 –user=xxx — –extend.query-path ./queries2.yaml
OK, now monitoring PostgreSQL metrics using DSN postgresql:***@localhost:5432/postgres
[root@db0pg1-1-prd ~]# pmm-admin list
pmm-admin 1.17.0
PMM Server | 10.252.203.232
Client Name | db0pg1-1-prd.eng.sfdc.net
Client Address | 10.252.203.232
Service Manager | linux-systemd
——————- ————————– ———– ——– ————————————— ——–
SERVICE TYPE NAME LOCAL PORT RUNNING DATA SOURCE OPTIONS
——————- ————————– ———– ——– ————————————— ——–
linux:metrics xxxxxx 42000 YES –
postgresql:metrics xxxxx 42005 YES postgresql:***@localhost:5432/postgres
Hello Dinesh,
Could you use a full path to your file for the flag extend.query-path?
e.g.
–extend.query-path /home/username/queries2.yaml
Rushi Reply
Hi Vadim, Yalovets, I have pg_stat_statements version 1.3 installed.. should it work ?
I actually installed and when i ran postgres_exporter with –extend.query-path its still throwing error
INFO[0173] Error running query on database “localhost:5432”: pg_stat_statements pq: relation “pg_stat_statements” does not exist source=”postgres_exporter.go:1286″
Hi Rushi,
Please make sure that your PostgreSQL instance was added to monitoring with a user that has superuser rights.
So this user can get information from pg_stat_statements.
e.g.
pguser=# show is_superuser;
is_superuser
————–
on
(1 row)
pguser=# select count(*) from pg_stat_statements;
-[ RECORD 1 ]
count | 36
Hi Vadim,
thank you for this nice tutorial!
I have a question regarding pmm-admin rm postgresql:metrics PS_NODE-1 part….I get a massage :
pmm-admin: error: enum value must be one of mysql,mongodb,postgresql,proxysql, got ‘postgresql:metrics’, try –help
Also when I try docker exec -it pmm-server pmm-admin list , it says: Unauthorized. Please check username and password.
BR
Nenad
Hi Nenad,
What PMM version is used?
Here are commands for PMM 2.x versions
$ pmm-admin remove postgresql
$ docker exec -it pmm-server pmm-admin list –server-url=http://username:password@localhost/
Hi Vadim,
Great tutorial.
Can I and/or how can I add –extend.query-path on linux docker postgres exporter?
Hi Nick,
We don’t have a docker container for our version of postgres exporter.
Hi Vadim,
Please help …
I have installed PMM1.6 and PMM client 1.71 , Node exprter working fine . Postgresql_exprters also working fine.
But when i removed and added postgresql exporter with extend query pmm-admin check-network showing down..
[root@sl73gseldbd192 prometheus]# pmm-admin add postgresql:metrics –user pmm_user –password secret postgres –host slxxxldbd192 –port 5432 –service-port 9187 –disable-ssl –extend.query-path /pgworkspace/software/prometheus/queries.yaml
* Connection: Client <– Server
——————- ————— ——————— ——- ———- ———
SERVICE TYPE NAME REMOTE ENDPOINT STATUS HTTPS/TLS PASSWORD
——————- ————— ——————— ——- ———- ———
linux:metrics slxxxldbd192 10.160.109.221:9100 OK NO –
postgresql:metrics postgres 10.160.109.221:9187 DOWN NO –
PMM Server | slxxxeldbd217 (insecure SSL)
Client Name | sxxxseldbd192.visa.com
Client Address | 10.1xx0.1xx9.xx21
Service Manager | linux-systemd
——————- ————— ———– ——– ——————————————– ————
SERVICE TYPE NAME LOCAL PORT RUNNING DATA SOURCE OPTIONS
——————- ————— ———– ——– ——————————————– ————
linux:metrics sl7xxldbd192 9100 YES – scheme=http
postgresql:metrics postgres 9187 YES postgresql:***@sl73gxxxd192:5432/postgres scheme=http
pmm_user=# show is_superuser
pmm_user-# ;
is_superuser
————–
on
(1 row)
Hi ,
Typo in my pmm-server version .. its pmm-server-1.16.0-12
Thanks
Siddesh
Hi Vadim,
i tried with same Server and client version 1.17.3 .. with extend-query-path not working …
time=”2020-03-31T09:35:20Z” level=info msg=”Starting postgres_exporter (version=, branch=, revision=)” source=”postgres_exporter.go:1132″
time=”2020-03-31T09:35:20Z” level=info msg=”Build context (go=go1.10.1, user=, date=)” source=”postgres_exporter.go:1133″
time=”2020-03-31T09:35:20Z” level=info msg=”Established new database connection.” source=”postgres_exporter.go:1015″
time=”2020-03-31T09:35:20Z” level=info msg=”Semantic Version Changed: 0.0.0 -> 11.2.0″ source=”postgres_exporter.go:945″
time=”2020-03-31T09:35:20Z” level=info msg=”Starting HTTP server for http://1x.1xx.1xx.2×1:9187/metrics …” source=”server.go:121″
Hello Siddesh,
Maybe the issue is related to amount of information as a result of used custom query.
Could you test with a simple custom query?
e.g.
https://gist.github.com/adivinho/6e6b938f276932b867fb44b8e007df65
Hi Vadim,
First , Thanks for the reply. It resolved after increasing the METRICS_RESOLUTION=5s
Thanks
Siddesh
Hello,
Is it possible to use this dashboard with already installed postgres_exporter from scratch, together with modified queries.yaml? Not to install PMM client separately? This is because i already have Prometheus and Grafana in environment and we have no need for PMM Server.
BR.
Savo
Hi Savo,
You should be able to use these dashboards. It were designed for PMM1 so no specific PMM2 variables are used yet (e.g. node_name, service_name …)
Great, will test it. Thanks Vadim! 🙂