While the PMM Engineering team is working on the polish for release of PMM 2, I wanted to share with you some of the dashboard improvements we’re making around PostgreSQL, specifically how you can plot Tuple Statistics using PMM. PMM (Percona Monitoring and Management) is a free and open-source platform for managing and monitoring MySQL®, MongoDB®, and PostgreSQL performance. You can run PMM in your own environment for maximum security and reliability. It provides thorough time-based analysis for MySQL, MongoDB, and PostgreSQL servers to ensure that your data works as efficiently as possible.
This new dashboard is based on data collected from the pg_stat_user_tables view. However, by default, postgres_exporter doesn’t collect this information. Instead we will leverage the exporter’s ability to run custom SELECT queries from a file (queries.yaml in our example). These generate metric series in PMM that we can then visualize. Collecting tuple information using pg_stat_user_users view requires that databases be identified in queries.yaml, so we’ve written a helper script that takes multiple database names and formats the queries.yaml file accordingly.
Setting up the dashboard
First of all we have to enable the extension dblink. It’s a PostgreSQL contrib extension that allows users to connect to other databases and to run arbitrary queries in them.
1 2 3 4 5 6 7 | postgres=# CREATE EXTENSION dblink; CREATE EXTENSION postgres=# SELECT dblink_connect('dbname=sbtest1'); dblink_connect ---------------- OK (1 row) |
The next step is to create a query for collecting data from tables. We propose to use our bash script that generates a query and forms other fields for a custom query file. You have to specify the database name, or names, that will be monitored. You can store the result of the script in a separate file or can extend an existing file with queries.
1 | [root@ip-10-178-1-82 ec2-user]# ./postgres_query_generator.sh sbtest1 sbtest2 sbtest3 >> queries.yaml |
Now lets run the exporter with this file /home/ec2-user/queries.yaml. Please use flag extend.query-path as in the example below. If you want to change exporter options, the procedure is to remove then add back the exporter with the new option identified.
1 2 3 4 5 | [root@ip-10-178-1-82 ec2-user]# pmm-admin rm postgresql:metrics PS_NODE-1 OK, removed PostgreSQL metrics PS_NODE-1 from monitoring. [root@ip-10-178-1-82 ec2-user]# pmm-admin add postgresql:metrics --user postgres PS_NODE-1 -- --extend.query-path /home/ec2-user/queries.yaml OK, now monitoring PostgreSQL metrics using DSN postgresql:***@/postgres |
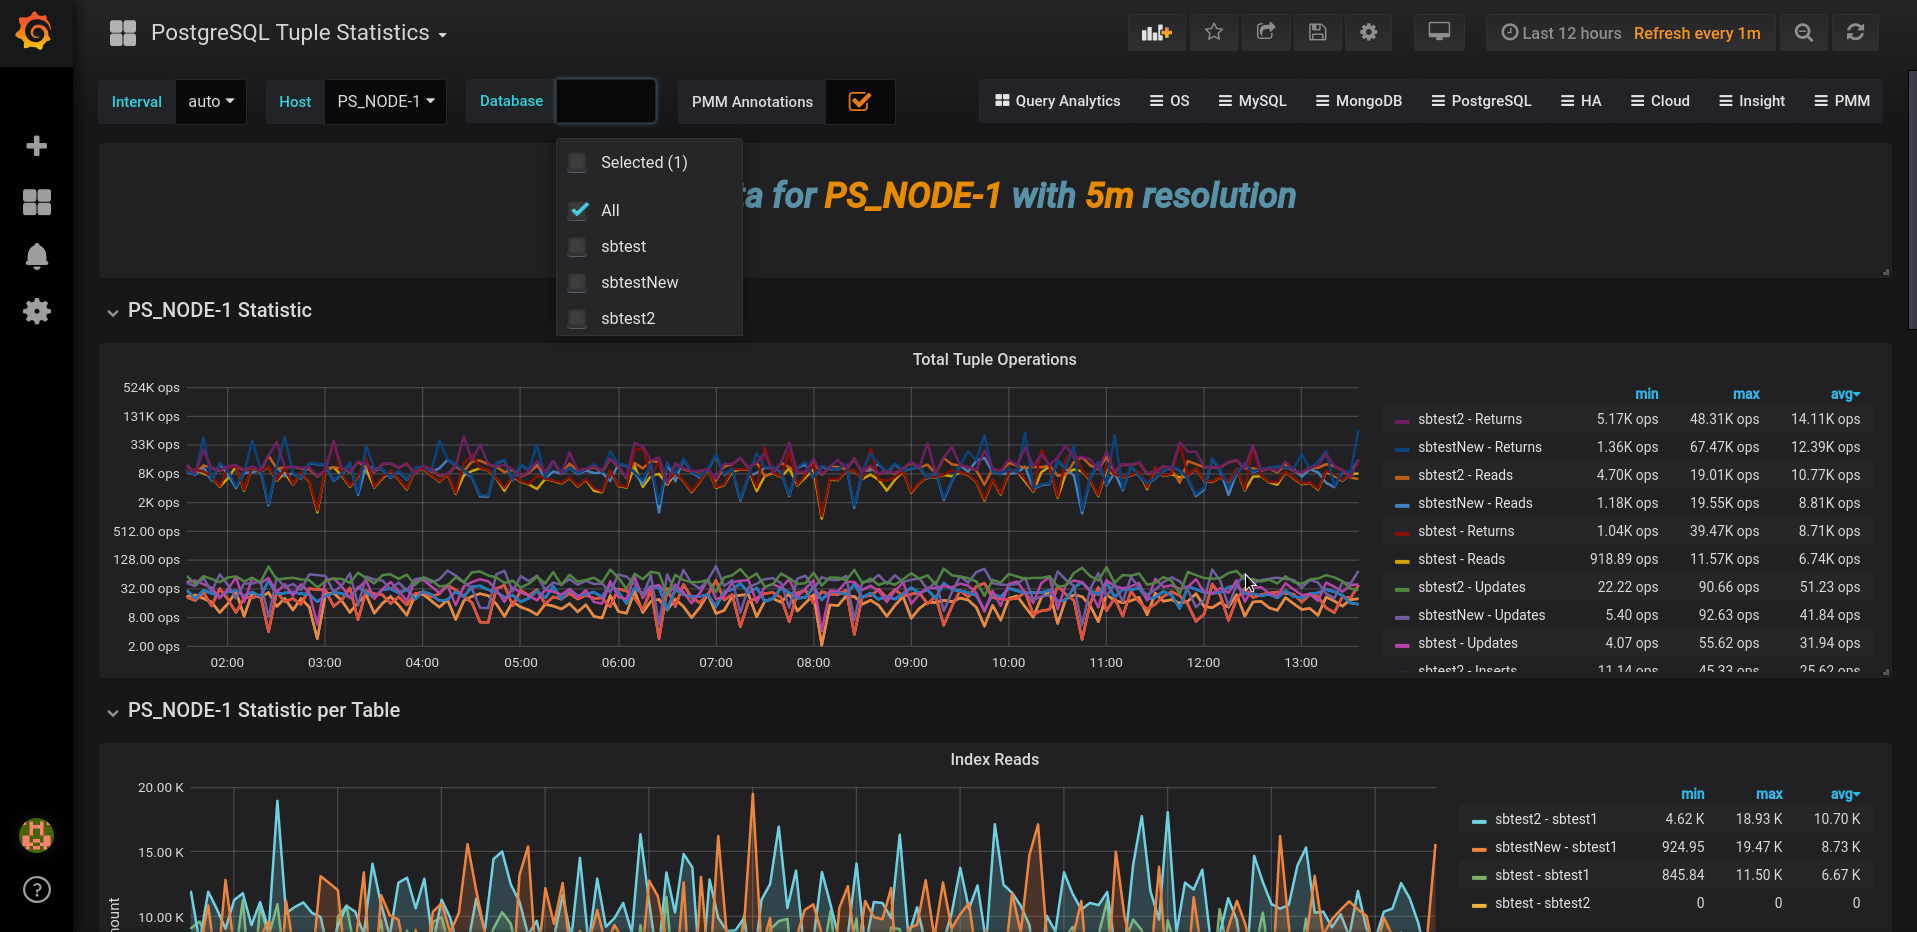
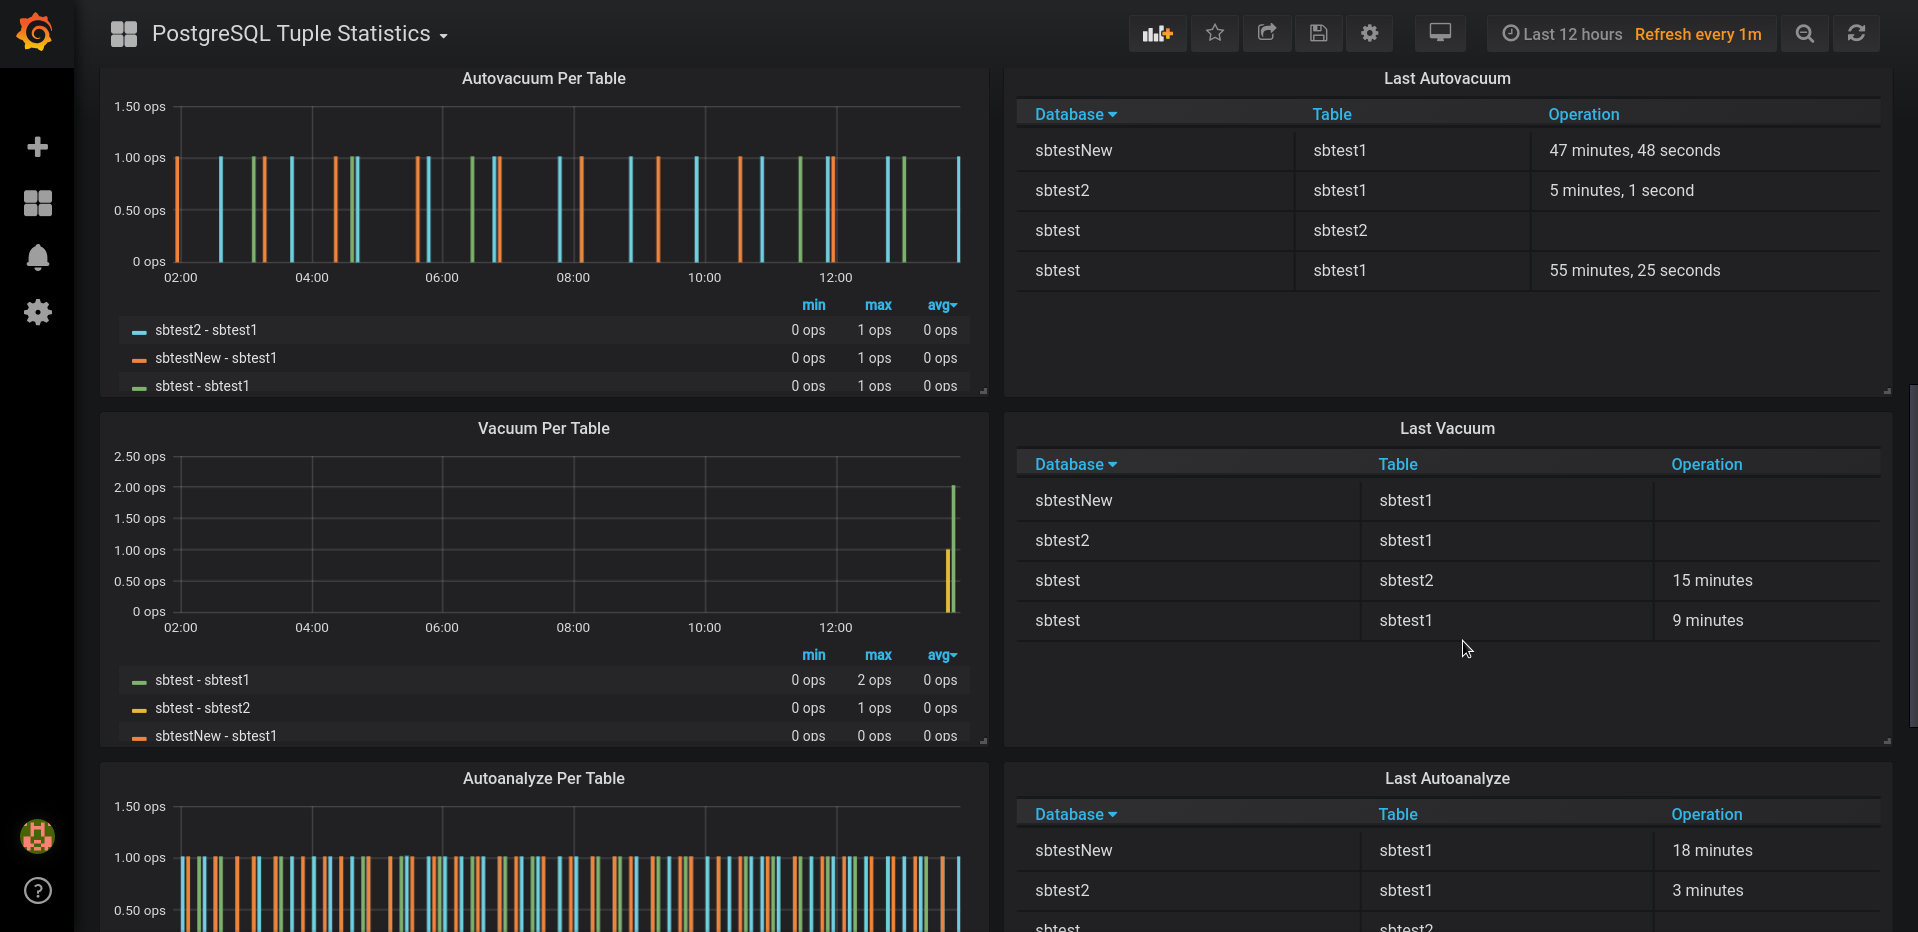
The PostgreSQL Tuple Statistics Dashboard is available on GrafanaLab for download under the perconalab organization.
Here are some screenshots from our test installation.