

In this post, we’ll discuss what constitutes a big innodb_log_file_size, and how it can affect performance.
In the comments for our post on Percona Server 5.7 performance improvements, someone asked why we use innodb_log_file_size=10G with an indication that it might be too big?
In my previous post, the example used innodb_log_file_size=15G. Is that too big? Let’s take a more detailed look at this.
Looking at innodb_log_file_size
First, let me start by rephrasing my warning: the log file size should be set as big as possible, but not bigger than necessary. A bigger log file size is better for performance, but it has a drawback (a significant one) that you need to worry about: the recovery time after a crash. You need to balance recovery time in the rare event of a crash recovery versus maximizing throughput during peak operations. This limitation can translate to a 20x longer crash recovery process!
But how big is “big enough”? Is it 48MB (the default value), 1-2GB (which I often see in production), or 10-15GB (like we use for benchmarks)?
I wrote about how the innodb_log_file_size is related to background flushing five years ago, and I recommend this post if you are interested in details:
https://www.percona.com/blog/2011/04/04/innodb-flushing-theory-and-solutions/
Since that time many improvements have been made both in Percona Server and MySQL, but a small innodb_log_file_size still affects the throughput.
How? Let’s review how writes happen in InnoDB. Practically all data page writes happen in the background. It seems as background writes shouldn’t affect user query performance, but it does. The more intense background writes are, the more resources are taken away from the user foreground workload. There are three big forces that rule background writes:
- How close checkpoint age is to the async point (again, see previous material). This is adaptive flushing.
- How close is innodb_max_dirty_pages_pct to the percentage of actual dirty pages? You can see this in the LRU flushing metrics.
- What amount of free pages are defined by innodb_lru_scan_depth. This is also in LRU flushing metrics.
So in this equation innodb_log_file_size defines the async point, and how big checkpoint age can be.
To show a practical application of these forces, I’ve provided some chart data. I will use charts from the Percona Monitoring and Management tool and data from Percona Server 5.7.
Before jumping to graphs, let me remind you that the max checkpoint age is defined not only by innodb_log_file_size, but also innodb_log_files_in_group (which is usually “2” by default). So innodb_log_file_size=2GB will have 4GB of log space, from which MySQL will use about 3.24GB (MySQL makes extra reservations to avoid a situation when we fully run out of log space).
Below are graphs from a tpcc-mysql benchmark with 1500 warehouses, which provides about 150GB of data. I used innodb_buffer_pool_size=64GB, and I made two runs:
- with innodb_log_file_size=2GB
- with innodb_log_file_size=15GB
Other details about my setup:
- CPU: 56 logical CPU threads servers Intel(R) Xeon(R) CPU E5-2683 v3 @ 2.00GHz
- OS: Ubuntu 16.04
- Kernel 4.4.0-21-generic
- The storage device is Samsung SM863 SATA SSD, single device, with ext4 filesystem
- MySQL versions: Percona Server 5.7.11
- innodb_io_capacity=5000 / innodb_io_capacity_max=7500
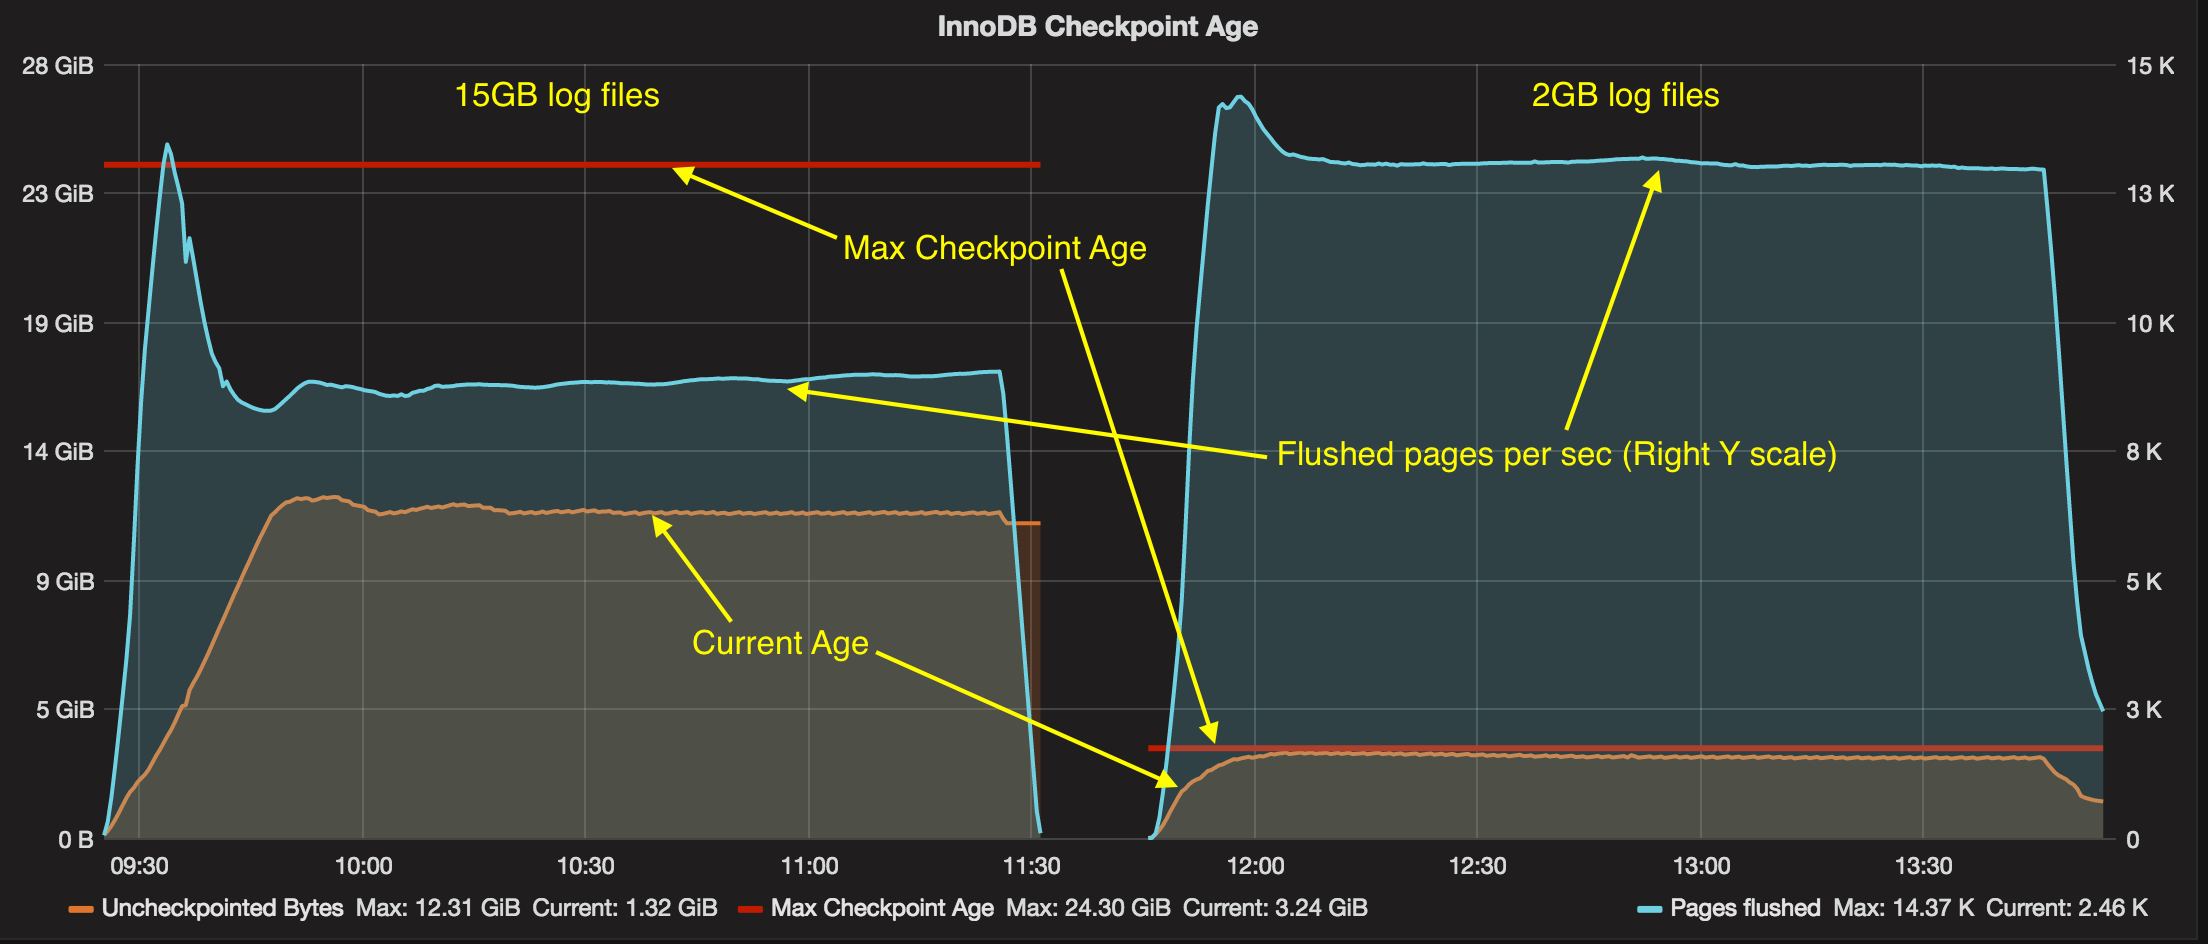
On the first chart, let’s look at the max checkpoint age, current checkpoint age and amount of flushed pages per second:
. . . and also a related graph of how many pages are flushed by different forces (LRU flushing and adaptive flushing). You can receive this data by enabling innodb_monitor_enable = '%'.
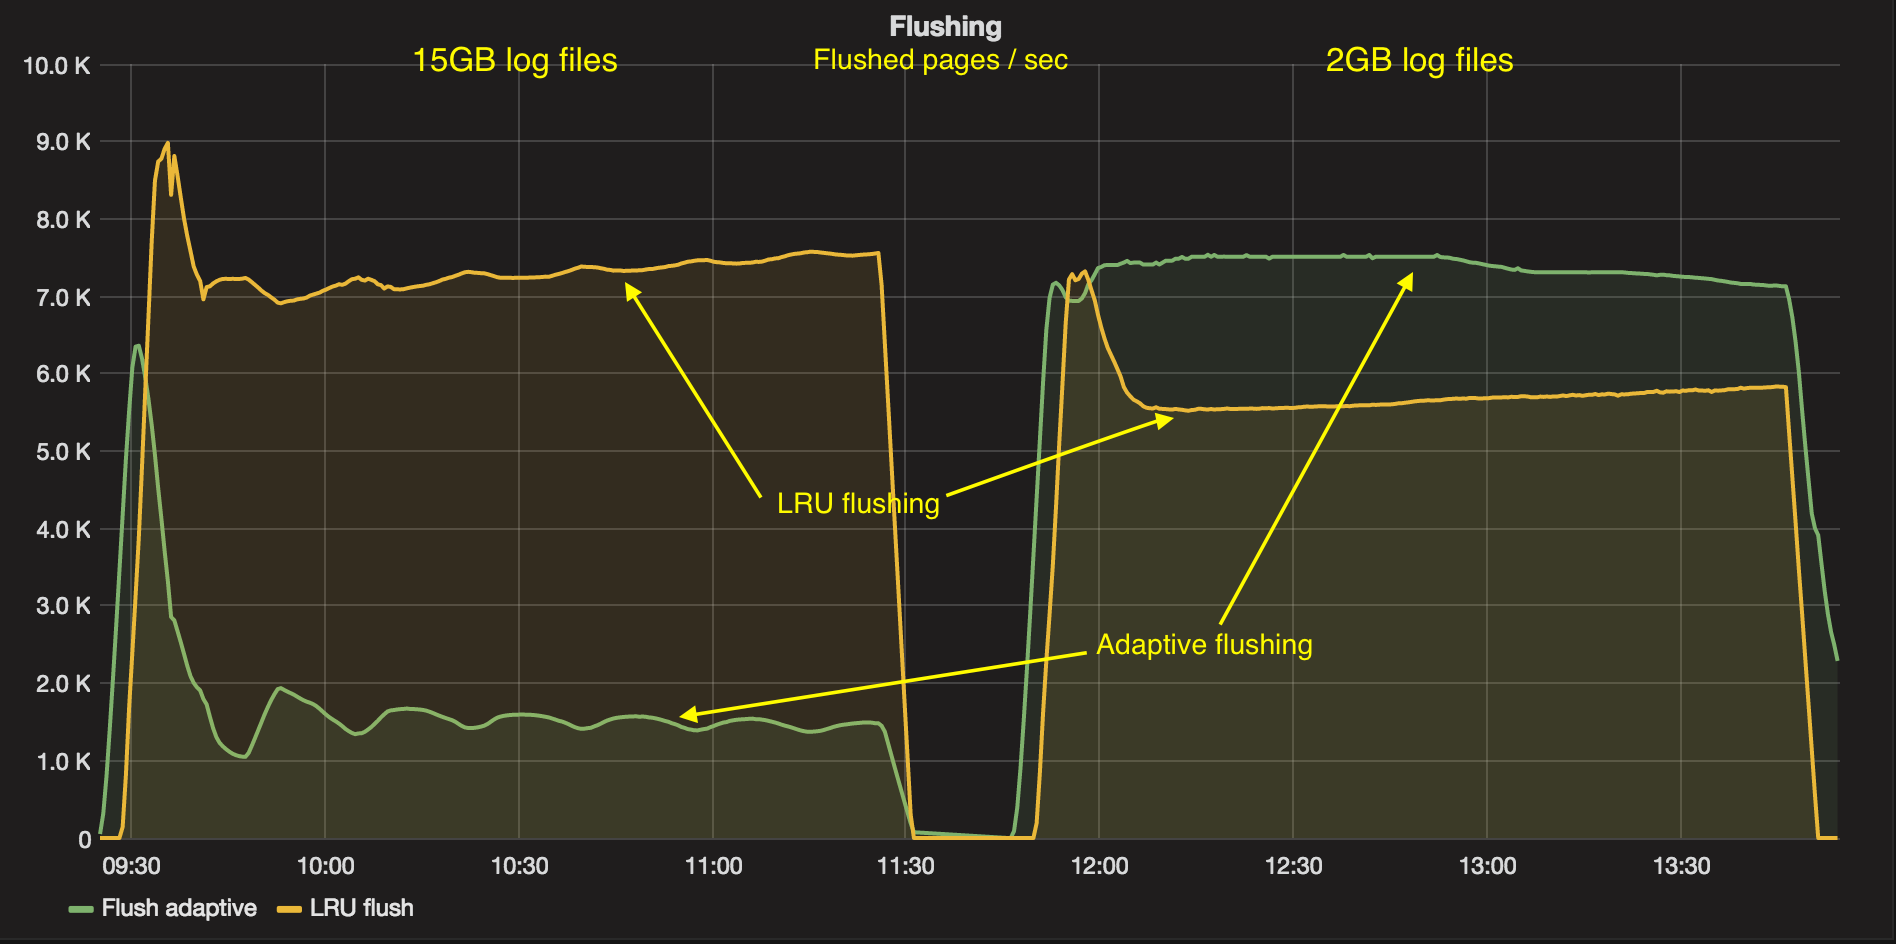
From these charts, we can see that with 2GB innodb_log_file_size InnoDB is forced by adaptive flushing to flush (write) more pages, because the current checkpoint age (uncheckpointed bytes) is very close to Max Checkpoint Age. To see the checkpoint age in MySQL, you can use the innodb_metrics table and metrics recovery_log_lsn_checkpoint_age and recovery_log_max_modified_age_sync.
In the case using innodb_log_file_size=15GB, the main flushing is done via LRU flushing (to keep 5000 pages ( innodb_lru_scan_depth) free per buffer pool instance). From the first graph we can figure that uncheckpointed bytes never reach 12GB, so in this case using innodb_log_file_size=15GB is overkill. We might be fine with innodb_log_file_size=8GB – but we wouldn’t know unless we set the innodb_log_file_size big enough. MySQL 5.7 comes with a very convenient improvement: now it is much easier to change the innodb_log_file_size, but it still requires a server restart. I wish we could change it online as we can for innodb_buffer_pool_size (I do not see technical barriers for this).
Let’s also look into the InnoDB buffer pool content:
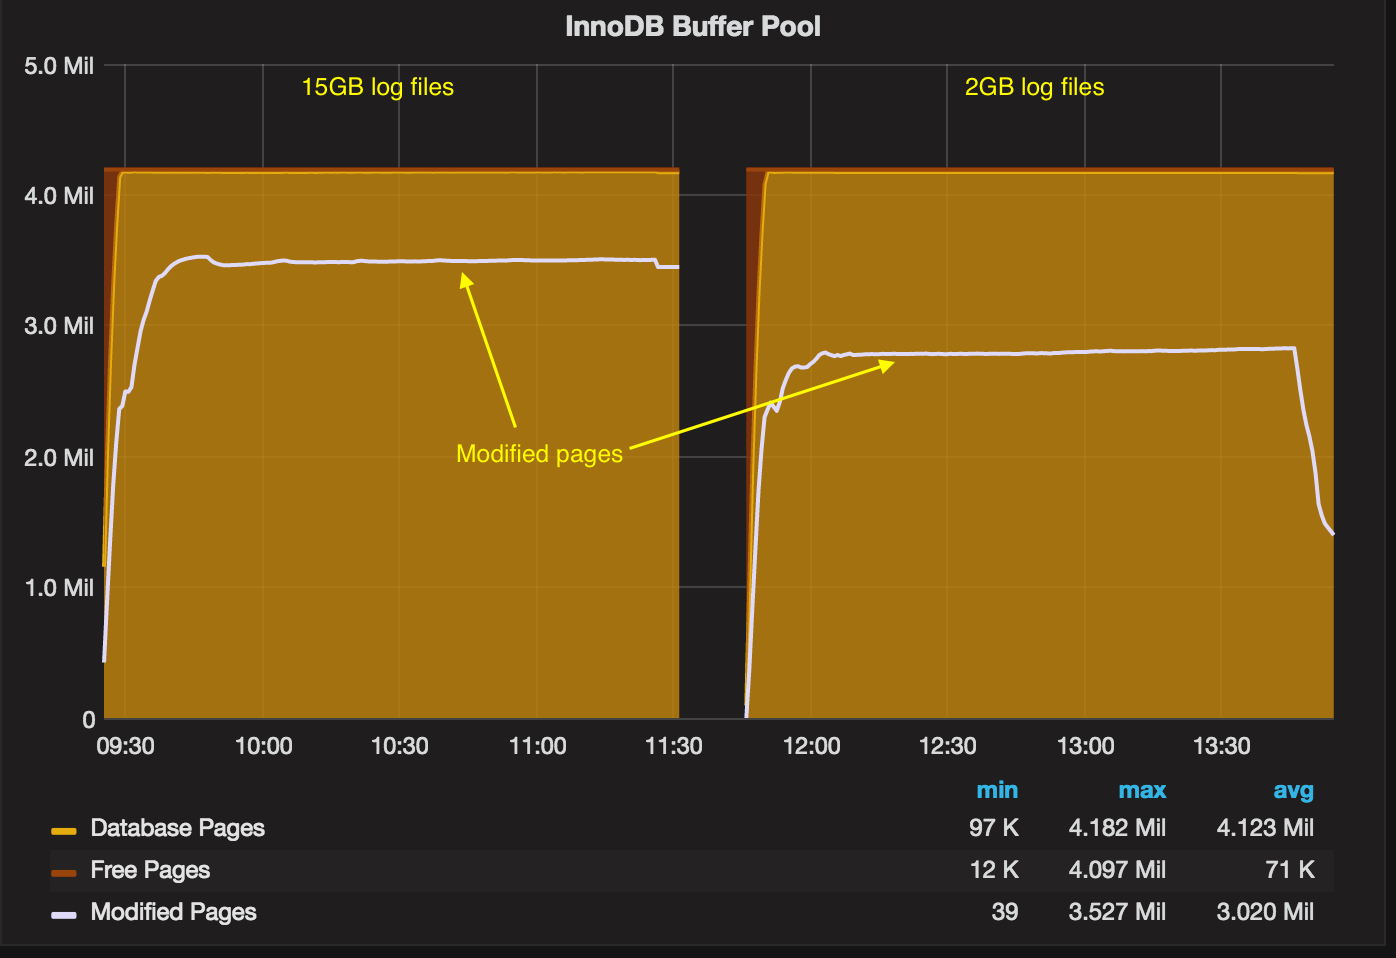
We can see that there are more modified pages in the case with 15GB log files (which is good, as more modified pages mean less work done in the background).
And the most interesting question: how does it affect throughput?
![]()
With innodb_log_file_size=2GB, the throughput is about 20% worse. With a 2GB log size, you can see that often zero transactions are processed within one second – this is bad and says that the flushing algorithm still needs improvements in cases when the checkpoint age is close to or at the async point.
This should make a convincing case that using big innodb_log_file_size is beneficial. In this particular case, probably 8GB (with innodb_log_files_in_group=2) would be enough.
What about the recovery time? To measure this, I killed mysqld when the checkpoint age (uncheckpointed bytes) was about 10GB. It appeared to take 20 mins to start mysqld after the crash. In another experiment with 25GB of uncheckpointed bytes, it took 45 mins. Unfortunately, crash recovery in MySQL is still singlethreaded, so it takes a long time to read and apply 10GB worth of changes (even from the fast storage).
We can see that recovery is single-threaded from the CPU usage chart during recovery:
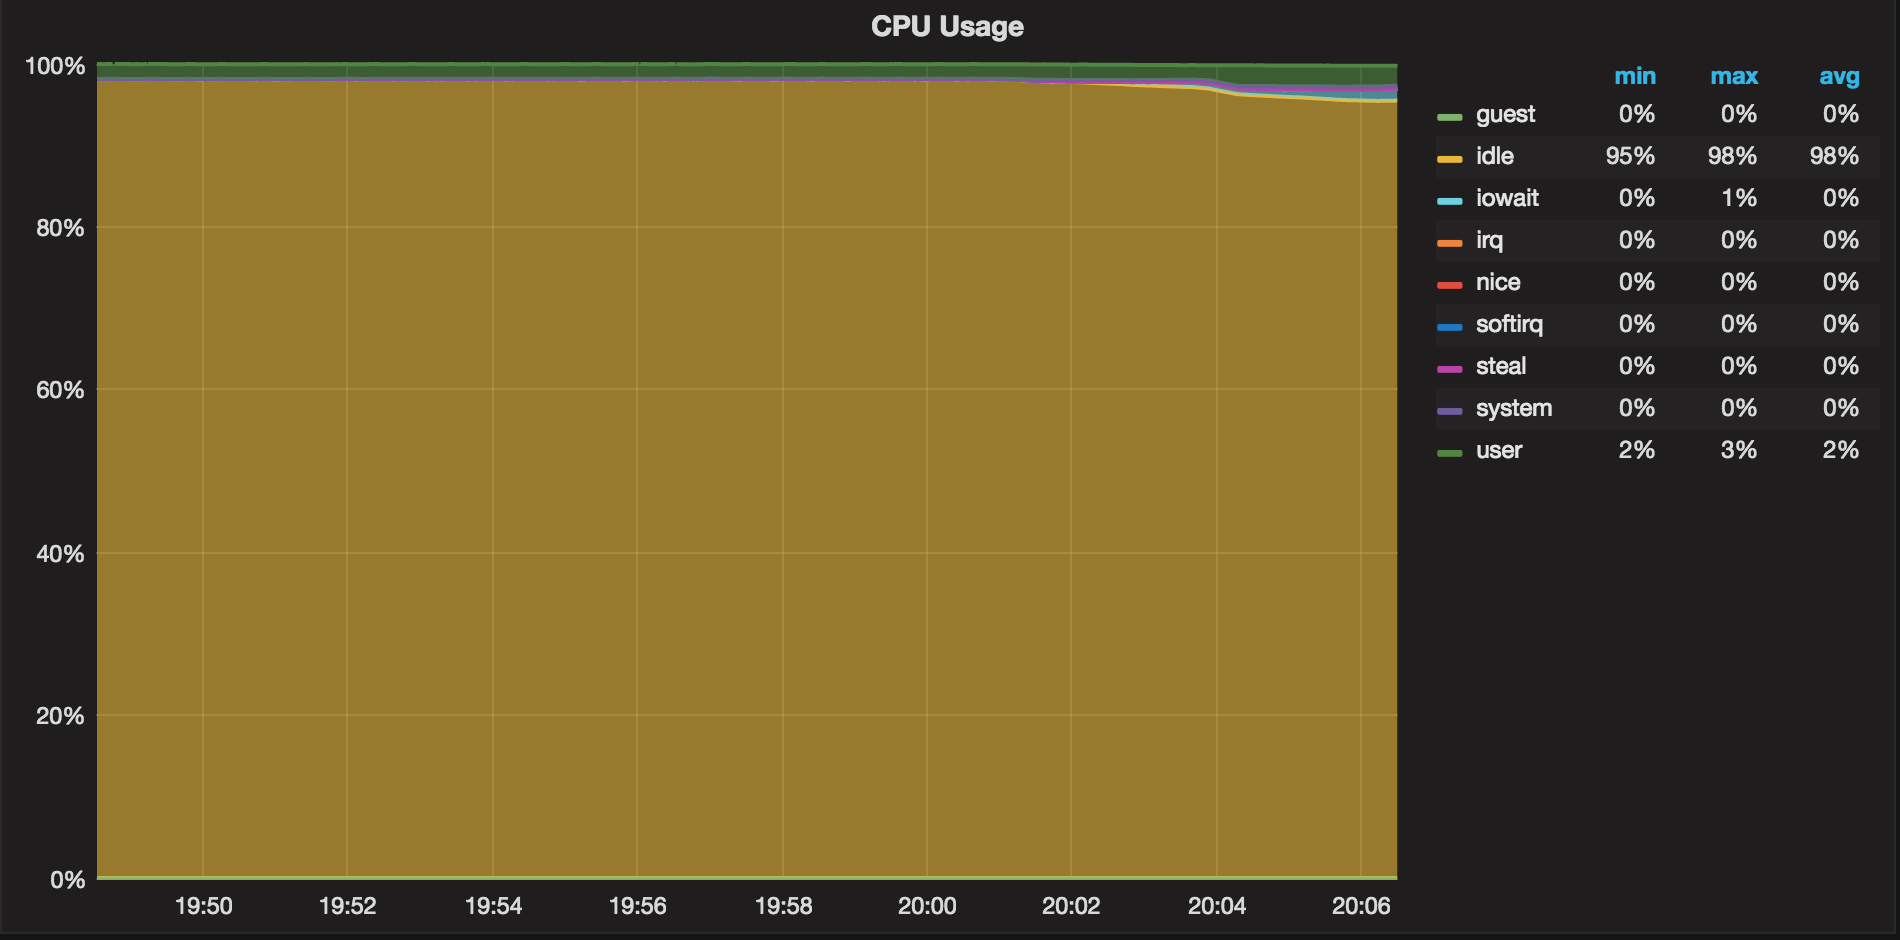
The system uses 2% of the CPU (which corresponds to a single CPU).
In many cases, crash recovery is not a huge concern. People don’t always have to wait for MySQL recovery – since even one minute of downtime can be too long, often the instance fails over to a slave (especially with async replication), or the crashed node just leaves the cluster (if you use Percona XtraDB Cluster).
I would still like to see improvements in this area. Crash recovery is the biggest showstopper for using a big innodb_log_file_size, and I think it is possible to add parallelism similar to multithreaded slaves into the crash recovery process.
You can find the raw results, scripts and configs here.


Vadim,
I think one good thing to point out is innodb_log_file_size matters for heavy write workloads. In a lot of writes are going on chances are your might not be pushing your Innodb Max Checkpoint age and log size might not be limiting for your workload. PMM has a graph for that 🙂
Somewhere I heard that 60 minutes was a good target for cycling the log files. This formula computes the value for
innodb_log_file_sizebased on that:Innodb_os_log_written / (Uptime / 3600) / innodb_log_files_in_group
Any comment on this? What was the value of such in your benchmarks? (Of course, it is hard to get that from the benchmark because it is either steady state or off.)
In my experience, I have rarely encountered a setting for log_file_size of 2GB or more. Only one case (out of several dozen) did that formula recommend more than 2GB.
I had exactly the same question Rick, and found the “somewhere” source: It was Baron Schwartz’s blogpost back in 2008, https://www.percona.com/blog/2008/11/21/how-to-calculate-a-good-innodb-log-file-size/.
Vadim, given current InnoDB optimizations, is this still a valid point in calculating a good InnoDB logfile size?
Rick,
I think 60 minutes recommendation is arbitrary and simply just wrong.

To show the example, this chart show log writes per hour.
You can see in some hours there is over 90GB writes into logs – but that absolutely does not mean we need to have 90GB of log space.
And if we look into Uncheckpointed bytes

There is barely 9Gb there.
So the most likely current total 30GB log size is overkill and just 12-15GB would be enough.
Thanks Vadim!
We mostly use our MySQL database servers for shared hosting of many, small, databases (for customer websites that require a MySQL database, like WordPress, Joomla and Drupal. They often don’t exceed a few hundred MB’s in size, some are “large”, between 900 MB and 2 GB.
Doing the log file size calculation, an
innodb_log_file_size = 256Mwould be more than enough to store an hour worth of data. Is there any reason – performance wise – to set this higher, to 1, 2 or even more GB’s?Jan,
So that’s what I tried to explain with this post.
To understand if you need to increase innodb_log_file_size – you need to see if Checkpoint Age is close to Async point.
You can check it with “mysql -e ‘show engine innodb status\G’ | awk ‘ BEGIN { } /Log sequence number/ {st=$4 } /Last checkpoint at/ { ed=$4; print (st-ed)/1024/1024 } ‘”
or better way to look at graphs like in this post – as it gives your historic information.
If Checkpoint Age is getting close to Async point – I would consider to increase innodb_log_file_size, say by 20%.
Then repeat again, but make sure you are happy with your crash recovery time.
Hi Vadim,
While applying your above code, we are getting something like: 0.00543022 (the number is always 0.00n every time we ran the above code). When examining the formula, I see that you are subtracting the “Log Sequence Number” from the “Last Checkpoint”, and getting the difference in megabytes.
My question is, why are you using the “Log Sequence Number” in your formula and not the “Pages Flushed Up to”, which seems to be the async point as it is taking place before “Log Sequence Number”? Also, why is the “Log Sequence Number” always identical to “Log Flushed Up To” (both seem to be the sync point).
Finally, what is an ideal value returned by the above formula? What is too close and what is too far? Is a few megs of difference comfortable?
The thing with such recommendations is this – Do you want simple recommendation or do you want the real one ? This is a simple one and it produces recommendation which is better than default but might not be optimal one.
Typically you will see performance improvements from increasing log files to be based on the law of diminishing returns with first increases giving you good performance boost and when later much less so.
The actual gains depend a lot of workload – updates hitting same database pages over and over tends to allow to eliminate writes with large log files helping a lot as well as IO performance – slow storage will find additional IO caused by smaller logs more taxing.
Also for most workloads you will have some sort of natural maximum log space which will be used – based on innodb_io_capacity and other factors – increasing logs beyond this value will not produce any gains.
I think the good way to set the optimal log files is to look at the Checkpoint Flushing IO as Vadim shows – while increasing log files allows you to substantially reduce such IO it is good to do so… keeping crash recovery times in mind.
Doesn’t this recommendation contradict the one you made in 2008? https://www.percona.com/blog/2008/11/21/how-to-calculate-a-good-innodb-log-file-size/
There, you state “Log file sizes can’t be left at the default 5MB for any real workload, but they often don’t need to be as big as you might think, either.”
Has that changed with 5.5 dramatically?