
 The all-new Percona Monitoring and Management (PMM) Home dashboard is the answer to some of the main concerns of our users:
- A clear entry point (where do I start?)
- Context (is everything okay?)
How did we achieve this? By coming up with a redesign of the Home dashboard so we can tackle the known performance issues that appeared when the number of monitored nodes increased, and also improve the overall experience.
Now, where is that new amazing Home dashboard? When you install/upgrade PMM to the 2.30.0 version, you are getting access to the Home dashboard, but not by default (yet). Since we would love to have as much feedback as possible from our user base as possible, we haven’t made the new Home dashboard the default one, so where is it?
Meet: The experimental dashboards directory
There are several ways to make it to the experimental directory, but the easiest way is to use the “Search Dashboards” option available in the left bar.

And scroll to find the “Experimental” directory:

Or, just directly write “new-home” in the textbox and click on the link:
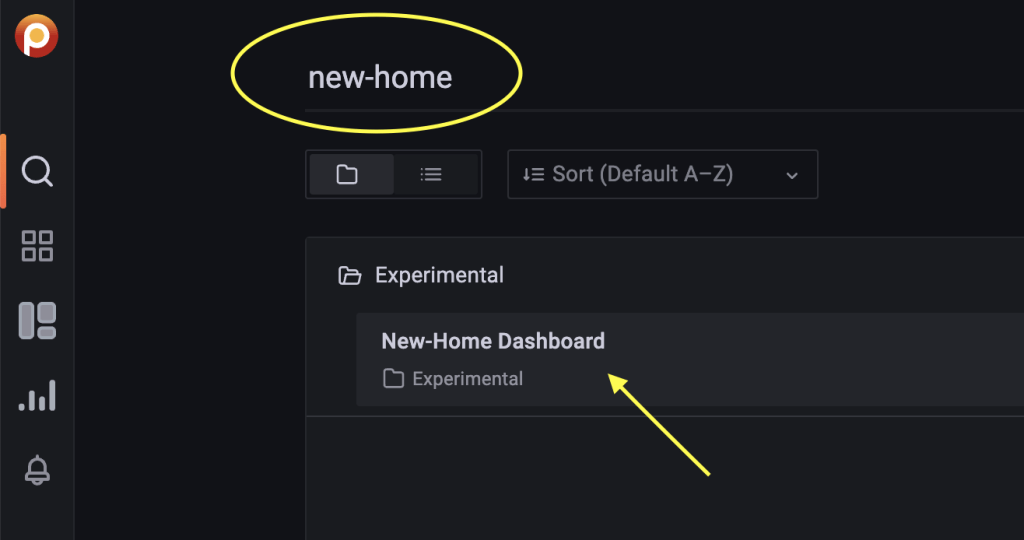
And that’s it! Once you’re there this is what you should be looking for:
The above screenshot is from the PMM Demo hosted by Percona, and you can access it by clicking this link.
Navigating the new Home dashboard
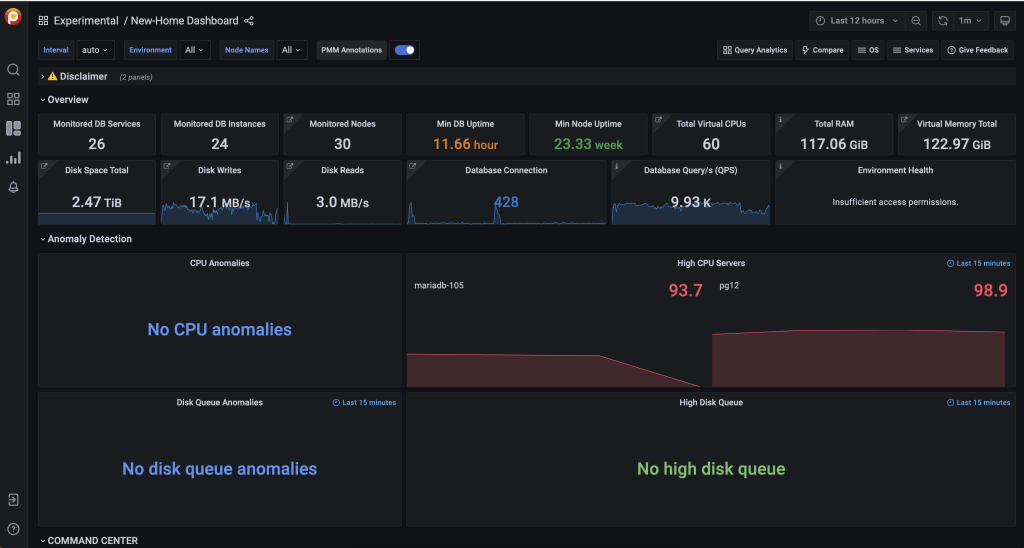
The idea behind this is simplicity. You as a user don’t need to be bombarded with tons of information that, in the end, is just noise. So, what are we looking at here?
Outliers, things that are odd, wrong, and shouldn’t be.
And outliers where? At the server level. Since PMM is a polyglot monitoring tool that spans from MySQL to PostgreSQL to MongoDB, and also monitors a couple of reverse proxy tools (HAProxy and ProxySQL), we gotta make sure that the home works for everyone – and what does everyone has in common? Server-level metrics!
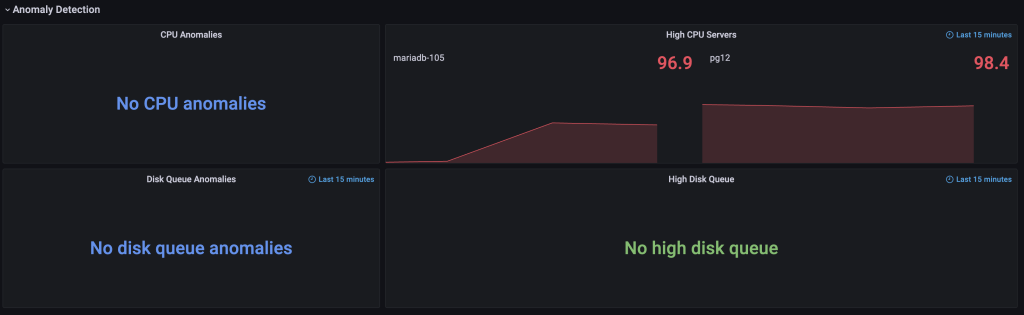
The Anomaly detection panel is pretty simple, the left part informs on CPU/Disk Queue anomalies and the right part shows wrong behavior, and by wrong we mean metrics beyond a high threshold for a considerable amount of time:
- CPU above 90% for more than 15 minutes
- Disk Queue above 20 requests over a minute
Those values are customizable but we consider them to be good enough to catch up on real issues and also reduce the probability of false positives.
Now, the anomaly detection part. As impressive as it sounds, it came out very simple, but for details let’s talk about the next panel
Command Center
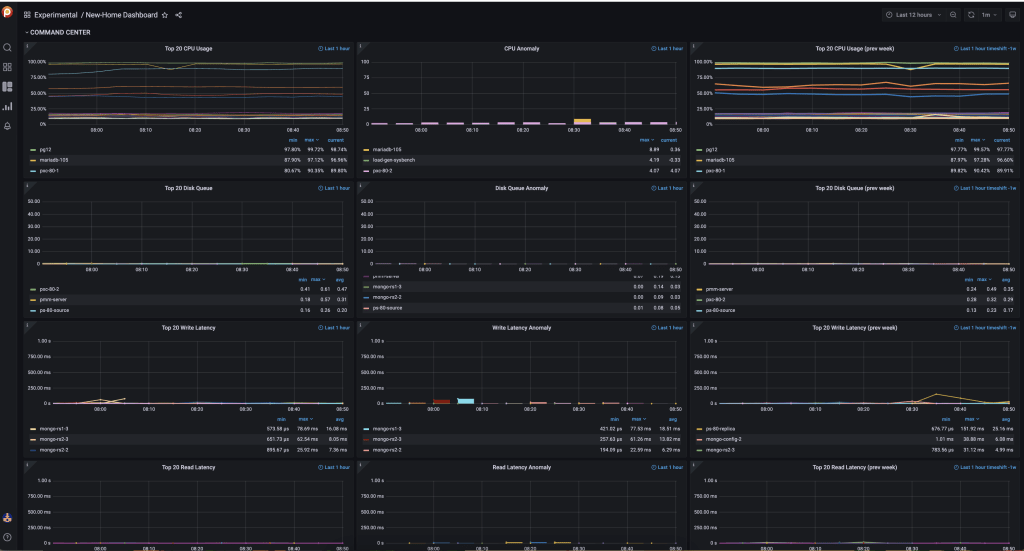
When designing the new Home dashboard, one of the main issues to tackle was the lack of context on the metrics provided: we can see that a CPU is at 50% but how do we know if that is expected or not? Is it normal behavior or is it an anomaly?
One of the considered options was to calculate the Z-Score. The standard score (or z-score) is a measure of the amount of standard deviation above or below the mean. Is a pretty cool way to find outliers. You can read more about it on Wikipedia: https://en.wikipedia.org/wiki/Standard_score.
However, out of simplicity and having scalability as a key condition, we ended up implementing a much more basic option: Seasonality, which is pretty much comparing the current value with the value for the same metric an X amount of time ago. In our case, we choose that amount of time to be a week. Why a week? Because it covers a big chunk of cases, for example:
Imagine you are a restaurant reservation app and your peak of traffic is on the weekends. What would you have to say about a CPU usage of 50%? Well, it depends on the day of the week and the hour. A Thursday night? Expected, and, in fact, probably a little bit low. But, what about a Monday morning? Totally wrong, an anomaly! Should be easy to spot.
We are calculating anomalies for:
- CPU usage
- Disk queue
- Disk Write latency
- Disk Read latency
- Memory usage
In the Command Center, it is easy to spot the trends by having graphs for the last hour and graphs for a week ago, also the last hour.
Making it the default Home dashboard
Do you like it enough to make it the new Home dashboard for your PMM? Here’s how to do it:
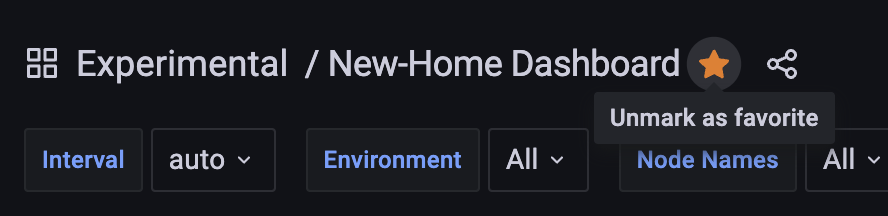
On the TOP left part, right next to the dashboard name, mark it as a FAVORITE.
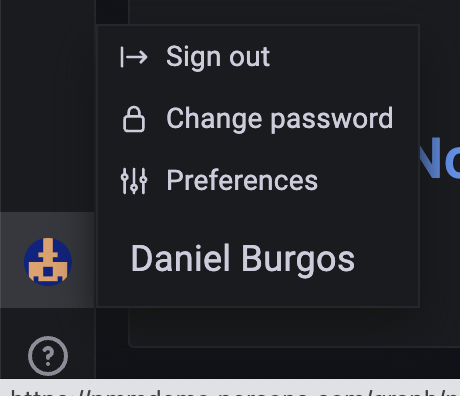
Now, go to the “Preferences” section by clicking on the link available at the left bar at the bottom.
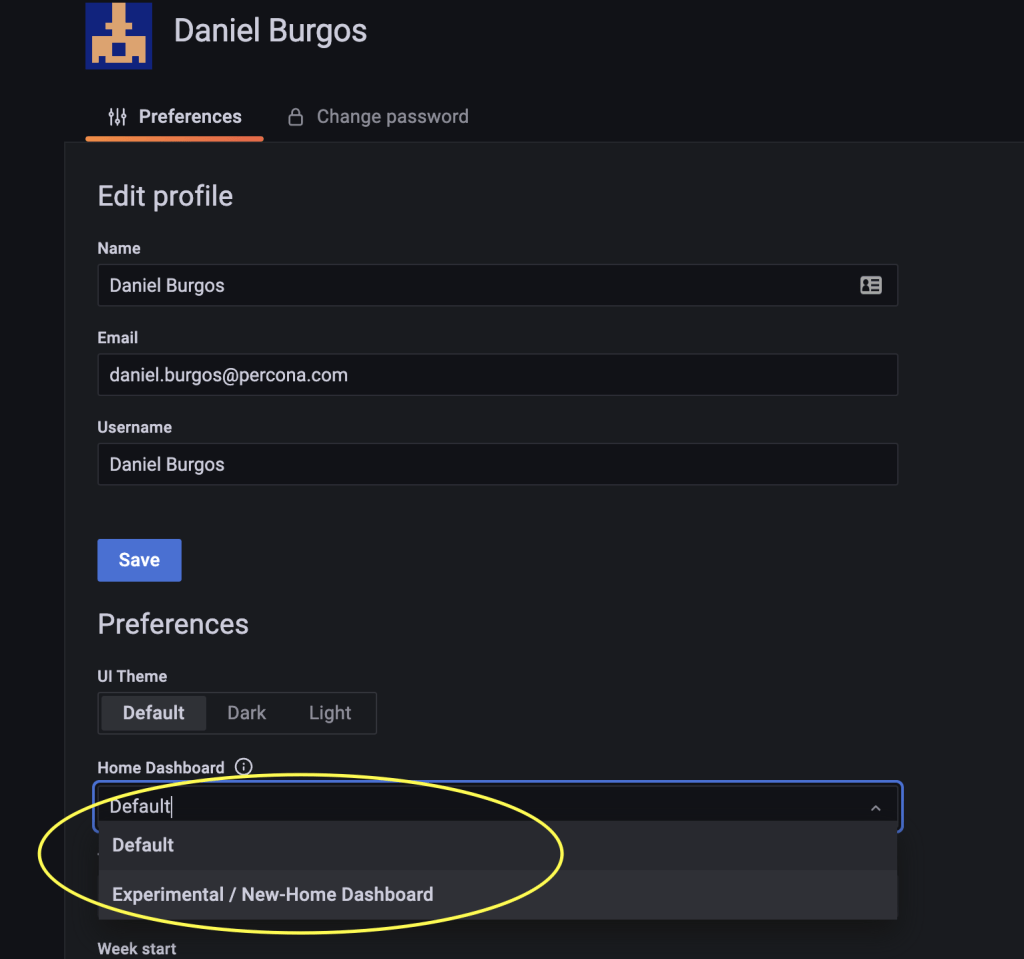
And finally, select the New-Home Dashboard as the default option. That’s it!
Final considerations
Is this good enough for debugging? No, but the idea of the Home dashboard is to work as a central health overview point to check in a bit on the status of your database fleet, identify any suspicious situations, and then go deep with the summary dashboards either for MySQL, Percona XtraDB Cluster, PostgreSQL, or MongoDB.
We would love to hear from you on this new Home dashboard, so feel free to hit the comment section or go directly to the forum (https://forums.percona.com/t/new-home-dashboard-feedback/16935) to leave us any feedback you have!
Percona Monitoring and Management is a best-of-breed open source database monitoring solution. It helps you reduce complexity, optimize performance, and improve the security of your business-critical database environments, no matter where they are located or deployed.


How to customize CPU for anomaly detection from 90% to 80%