

 In a previous post Profiling Software Using perf and Flame Graphs, we took a look at how to generate Flame Graphs from perf outputs. In this short follow-up, we will use Flame Graphs to process outputs from pt-pmp. Flame Graphs were not originally thought of for this purpose, but since pt-pmp outputs are similar to the folded samples (the result of using stackcollapse-perf.pl), we can take advantage of its functionality.
There are mainly two differences in the pt-pmp outputs:
- The first column is the number of threads with that same backtrace, and
- The function names are separated by a comma instead of a semicolon
Additionally, pt-pmp will print the date in the first line, so we’ll need to trim that part, too.
Lastly, before moving on, a word of caution. pt-pmp will use GDB in the background, which means that MySQL will stall while gathering the samples. Be sure to read the documentation before you consider running it in a production environment.
Installing Packages
Before we are able to use either tool, we need to make sure we have them installed. For pt-pmp we need to either follow the online documentation to install the Percona Toolkit or get the latest pt-pmp executable with:
1 2 3 | shell> cd ~/src shell> wget percona.com/get/pt-pmp shell> chmod +x ./pt-pmp |
For Flame Graphs, we can easily clone the GitHub project:
1 2 | shell> cd ~/src shell> git clone https://github.com/brendangregg/FlameGraph |
Running the Tools
Let’s assume we used a simple pt-pmp command like the following:
1 | shell> pt-pmp --pid=$(pgrep -x mysqld) > pt-pmp.out |
To overcome the differences outlined above, we can use a short BASH one-liner, like:
1 | shell> tail -n+2 pt-pmp.out | awk '{print $2, $1}' | sed -e 's/,/;/g' > pt-pmp.fgr.out |
These commands are doing the following:
- tail -n+2 pt-pmp.out -> is simply ignoring the first line, which has the date
- awk ‘{print $2, $1}’ -> is swapping the thread count and the backtrace columns
- sed -e ‘s/,/;/g’ -> is changing the comma for the semicolon
After this, we can use the perl script as usual:
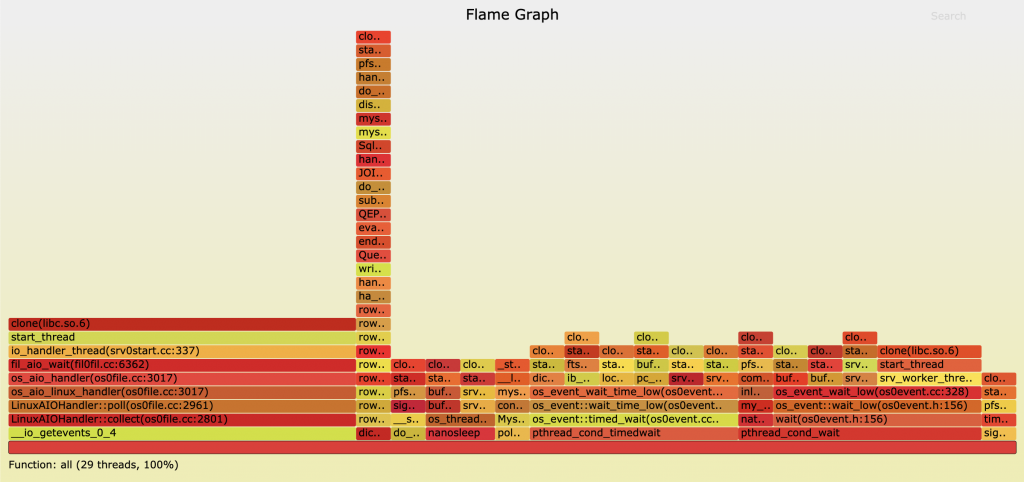
1 | shell> ~/src/FlameGraph/flamegraph.pl --countname="threads" pt-pmp.fgr.out > pt-pmp.fgr.out.svg |
The –countname argument is just to change the default “samples” text, so that it better reads as to what each count represents in this context, which is threads.
And we’ll get the expected svg file with the flame graph showing us the different backtraces and threads:
Percona Toolkit Addendum
Additionally, we can use pt-stalk to not only gather the typical information about OS- and MySQL-related metrics but to gather stack traces, too. This means we will also have in-depth information about what was going on in the server, to be able to make a better analysis.
You can read more about how to collect these samples in the online documentation.
As mentioned, while the traces are being collected via GDB, the system will be stalled. Be extremely careful about running this in a production environment!
Useful Links
pt-pmp – Aggregate GDB stack traces for a selected program.
pt-stalk – Collect forensic data about MySQL when problems occur.


