

While the PMM team works hard on our PMM 2.0 release, we have been working on a few things in the background which we’d like to show off ! In particular we have developed a new dashboard that displays metrics related to memory usage on Linux systems. The dashboard leverages information collected by node_exporter. The graphs take advantage of /proc filesystem files, specifically:
- meminfo: Provides information about distribution and utilization of memory. This varies by architecture and compile options.
- vmstat: Provides information about block IO and CPU activity in addition to memory.
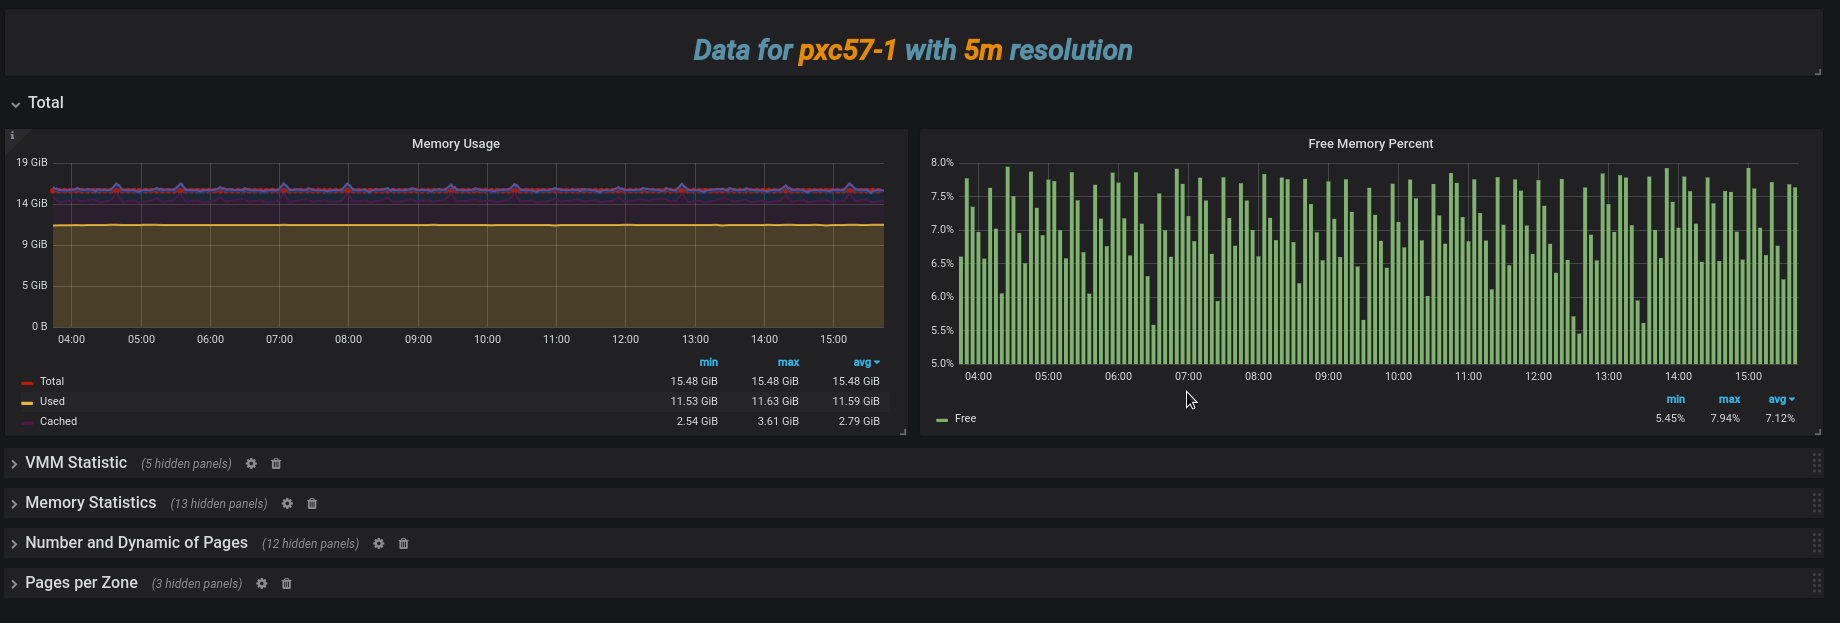
The information is split into five sections:
- Total Memory
- VMM (Virtual Memory Manager) Statistics
- Memory Statistics
- Number and Dynamic of Pages
- Pages per Zone
The dashboard will be included as part of the PMM 2.0 release. For you early adopters, you can get it from GrafanaLab and install it alongside your existing Dashboards – it won’t overwrite anything!
This dashboard works with all PMM Server versions starting with 1.7 (January 31, 2018).


