

In this blog, we’ll look at how to monitor Amazon Aurora using Percona Monitoring and Management (PMM).
One impact of the growth of web services such as AWS on DBAs is the need to understand and report on database and application resource usage. DBAs have always had to monitor for performance-related usability issues, which may have led to investment in larger servers. However, services such as Aurora operate pricing models based on usage. Performance issues can be more closely attributed to rising costs, so badly performing systems more visibly affect the bottom line. DBA has become a cost center!
With that in mind, from Percona Monitoring and Management (PMM) 1.5 onwards, we delivered features that provide enhanced support for the performance monitoring of Amazon Aurora instances. “[Aurora] is a fully managed, MySQL- and PostgreSQL-compatible, relational database engine.” (Amazon docs).
Here’s a walkthrough of some of the key features in PMM that could benefit DBAs managing Aurora, and eliminate the need for additional monitoring nodes. The images here, pulled up from our demo system, display a seven-day overview of one of our test instances. You can focus tightly on the past five minutes or pan out to the last five years, depending on your analysis requirements.
Starting with this dashboard summary, which appears at the top of the screen, PMM displays an instant summary on the “health” of your instance.

Engine uptime and CPU Utilization are helpfully highlighted in green, reinforcing a healthy status. Amber or red alerts means pay attention to the instance and whether there have been issues in the recent past.
In this case, we can see that Aurora was last restarted 2.1 weeks ago.
The next three statistics in this section cover the current status of the instance at the time you loaded the dashboard. Aurora is using ~15% of the available CPU resources. Your application is asking approximately ~400 queries per second.There is 370MiB of unused RAM at the current time.
Aurora Costs
The next four graphs are closely aligned with running costs. In creating these graphs, PMM calls on Amazon’s CloudWatch service. This provides up to one million API calls per month as part of your service, without additional charge (December 2017). A refresh of these graphs uses 15 calls, and you can configure the refresh frequency.
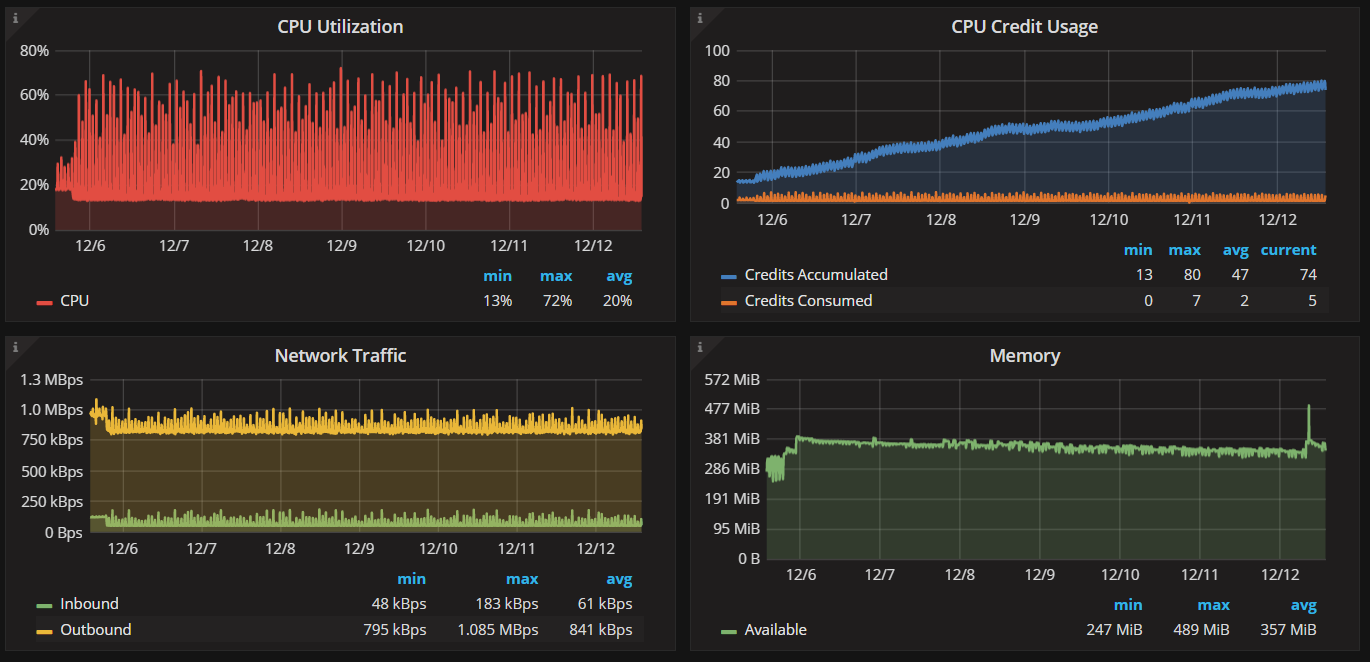
Three of these graphs represent CPU Utilization, Network Traffic and Memory Usage. As a DBA you are likely to be familiar with these terms. PMM displays these as a metric series over time.
The fourth graph of CPU Credit Usage, top right, covers usage credit and applies specifically to Aurora MySQL db.t2.small and db.t2.medium instances. There are two parameters in play here. CPUCreditBalance represents the number of CPU credits accumulated during the specified time, allocated to the instance’s virtual CPU. CPUCreditUsage represents the actual CPU used during the same period. In essence, the gap between the two indicates the capacity of the instance to operate beyond its baseline performance level at a given rate.
Our demo instance, which runs a synthetic workload based on sysbench, is showing a regular usage pattern and accumulating credit. It’s no surprise that we are not bursting our CPU requests. This pattern of use is less likely to apply to a real-life application.
By the way, clicking on any graph in PMM displays it in full screen, so we don’t restrict your view to a quadrant of the screen.
Aurora MySQL
Next up, there’s a set of four graphs representing MySQL specific metrics. These show information that’s important to DBAs as a matter of course. They take on more significance if you’re seeking opportunities to tune applications to minimise costs.
The Percona Database Performance blog has lots of blog posts that cover these metrics in more detail, and we may well revisit them in due course in the context of Aurora MySQL. For this review of PMM, it’s enough to say that each of these would have its place in tuning with a view to improving your overall efficiency.

Summary
Since charges for web services are based on usage, the role of the DBA is in the spotlight. You need to optimize usage, and PMM 1.5 can help you achieve that for Amazon Aurora thanks to these features:
- Dedicated Aurora dashboard which offers maximum visibility into key database characteristics
- Simple configuration of key Aurora settings via a web interface.
- We renamed Amazon RDS OS Metrics to Amazon RDS / Amazon MySQL Metrics. This better reflects the Amazon Data Services that we support.
And did you know that beyond providing PMM, Percona has built a reputation for MySQL and now Amazon Aurora proficiency? We recently worked with Lookout to increase efficiency and more effectively use their Amazon Aurora deployment to save Lookout hundreds of thousands of dollars! If you think you could benefit from this kind of Amazon Aurora or other MySQL assistance, please contact us!


default of . <<< fyi