

 In this blog, we’ll look at ICP counters in the information_schema.INNODB_METRICS. This is part two of the Index Condition Pushdown (ICP) counters blog post series.
As mentioned in the previous post, in this blog we will look at how to check on ICP counters on MySQL and Percona Server for MySQL. This also applies to MariaDB, since the INNODB_METRICS table is also available for MariaDB (as opposed to the Handler_icp_% counters being MariaDB-specific). We will use the same table and data set as in the previous post.
For simplicity we’ll show the examples on MySQL 5.7.18, but they also apply to the latest Percona Server for MySQL (5.7.18) and MariaDB Server (10.2.5):
1 2 3 4 5 6 7 8 9 10 11 12 13 14 15 16 17 18 19 20 21 22 23 24 25 26 27 28 29 30 31 32 33 34 35 36 37 38 39 40 41 42 43 44 45 | mysql [localhost] {msandbox} (test) > SELECT @@version, @@version_comment; +-----------+------------------------------+ | @@version | @@version_comment | +-----------+------------------------------+ | 5.7.18 | MySQL Community Server (GPL) | +-----------+------------------------------+ 1 row in set (0.00 sec) mysql [localhost] {msandbox} (test) > SHOW CREATE TABLE t1G *************************** 1. row *************************** Table: t1 Create Table: CREATE TABLE `t1` ( `f1` int(11) DEFAULT NULL, `f2` int(11) DEFAULT NULL, `f3` int(11) DEFAULT NULL, KEY `idx_f1_f2` (`f1`,`f2`) ) ENGINE=InnoDB DEFAULT CHARSET=latin1 1 row in set (0.00 sec) mysql [localhost] {msandbox} (test) > SELECT COUNT(*) FROM t1; +----------+ | COUNT(*) | +----------+ | 3999996 | +----------+ 1 row in set (3.98 sec) mysql [localhost] {msandbox} (test) > SELECT * FROM t1 LIMIT 12; +------+------+------+ | f1 | f2 | f3 | +------+------+------+ | 1 | 1 | 1 | | 1 | 2 | 1 | | 1 | 3 | 1 | | 1 | 4 | 1 | | 2 | 1 | 1 | | 2 | 2 | 1 | | 2 | 3 | 1 | | 2 | 4 | 1 | | 3 | 1 | 1 | | 3 | 2 | 1 | | 3 | 3 | 1 | | 3 | 4 | 1 | +------+------+------+ 12 rows in set (0.00 sec) |
Before proceeding with the examples, let’s see what counters we have available and how to enable and query them. The documentation page is at the following link: https://dev.mysql.com/doc/refman/5.7/en/innodb-information-schema-metrics-table.html.
The first thing to notice is that we are advised to check the validity of the counters for each version where we want to use them. The counters represented in the INNODB_METRICS table are subject to change, so for the most up-to-date list it’s best to query the running MySQL server:
1 2 3 4 5 6 7 8 9 10 | mysql [localhost] {msandbox} (test) > SELECT NAME, SUBSYSTEM, STATUS FROM information_schema.INNODB_METRICS WHERE NAME LIKE '%icp%'; +------------------+-----------+----------+ | NAME | SUBSYSTEM | STATUS | +------------------+-----------+----------+ | icp_attempts | icp | disabled | | icp_no_match | icp | disabled | | icp_out_of_range | icp | disabled | | icp_match | icp | disabled | +------------------+-----------+----------+ 4 rows in set (0.00 sec) |
Looking good! We have all the counters we expected, which are:
- icp_attempts: the number of rows where ICP was evaluated
- icp_no_match: the number of rows that did not completely match the pushed WHERE conditions
- icp_out_of_range: the number of rows that were checked that were not in a valid scanning range
- icp_match: the number of rows that completely matched the pushed WHERE conditions
This link to the code can be used for reference: https://github.com/mysql/mysql-server/blob/5.7/include/my_icp.h.
After checking which counters we have at our disposal, you need to enable them (they are not enabled by default). For this, we can use the “modules” provided by MySQL to group similar counters for ease of use. This is also explained in detail in the documentation link above, under the “Counter Modules” section. INNODB_METRICS counters are quite inexpensive to maintain, as you can see in this post by Peter Z.
1 2 3 4 5 6 7 8 9 10 11 12 13 | mysql [localhost] {msandbox} (test) > SET GLOBAL innodb_monitor_enable = module_icp; Query OK, 0 rows affected (0.00 sec) mysql [localhost] {msandbox} (test) > SELECT NAME, SUBSYSTEM, STATUS FROM information_schema.INNODB_METRICS WHERE NAME LIKE '%icp%'; +------------------+-----------+---------+ | NAME | SUBSYSTEM | STATUS | +------------------+-----------+---------+ | icp_attempts | icp | enabled | | icp_no_match | icp | enabled | | icp_out_of_range | icp | enabled | | icp_match | icp | enabled | +------------------+-----------+---------+ 4 rows in set (0.00 sec) |
Perfect, we now know what counters we need, and how to enable them. We just need to know how to query them, and we can move on to the examples. However, before rushing into saying that a simple SELECT against the INNODB_METRICS table will do, let’s step back a bit and see what columns we have available that can be of use:
1 2 3 4 5 6 7 8 9 10 11 12 13 14 15 16 17 18 19 20 21 22 23 | mysql [localhost] {msandbox} (test) > DESCRIBE information_schema.INNODB_METRICS; +-----------------+--------------+------+-----+---------+-------+ | Field | Type | Null | Key | Default | Extra | +-----------------+--------------+------+-----+---------+-------+ | NAME | varchar(193) | NO | | | | | SUBSYSTEM | varchar(193) | NO | | | | | COUNT | bigint(21) | NO | | 0 | | | MAX_COUNT | bigint(21) | YES | | NULL | | | MIN_COUNT | bigint(21) | YES | | NULL | | | AVG_COUNT | double | YES | | NULL | | | COUNT_RESET | bigint(21) | NO | | 0 | | | MAX_COUNT_RESET | bigint(21) | YES | | NULL | | | MIN_COUNT_RESET | bigint(21) | YES | | NULL | | | AVG_COUNT_RESET | double | YES | | NULL | | | TIME_ENABLED | datetime | YES | | NULL | | | TIME_DISABLED | datetime | YES | | NULL | | | TIME_ELAPSED | bigint(21) | YES | | NULL | | | TIME_RESET | datetime | YES | | NULL | | | STATUS | varchar(193) | NO | | | | | TYPE | varchar(193) | NO | | | | | COMMENT | varchar(193) | NO | | | | +-----------------+--------------+------+-----+---------+-------+ 17 rows in set (0.00 sec) |
There are two types: %COUNT and %COUNT_RESET. The former counts since the corresponding counters were enabled, and the latter since they were last reset (we have the TIME_% columns to check when any of these were done). This is why in our examples we are going to check the %COUNT_RESET counters, so we can reset them before running each query (as we did with FLUSH STATUS in the previous post).
Without further ado, let’s check how this all works together:
1 2 3 4 5 6 7 8 9 10 11 12 13 14 15 16 17 18 19 20 21 22 23 24 25 26 27 28 29 30 | mysql [localhost] {msandbox} (test) > SET GLOBAL innodb_monitor_reset = module_icp; Query OK, 0 rows affected (0.00 sec) mysql [localhost] {msandbox} (test) > SELECT * FROM t1 WHERE f1 < 3 AND (f2 % 4) = 1; +------+------+------+ | f1 | f2 | f3 | +------+------+------+ | 1 | 1 | 1 | | 2 | 1 | 1 | +------+------+------+ 2 rows in set (0.00 sec) mysql [localhost] {msandbox} (test) > SELECT NAME, COUNT_RESET FROM information_schema.INNODB_METRICS WHERE NAME LIKE 'icp%'; +------------------+-------------+ | NAME | COUNT_RESET | +------------------+-------------+ | icp_attempts | 9 | | icp_no_match | 6 | | icp_out_of_range | 1 | icp_match | 2 | +------------------+-------------+ 4 rows in set (0.00 sec) mysql [localhost] {msandbox} (test) > EXPLAIN SELECT * FROM t1 WHERE f1 < 3 AND (f2 % 4) = 1; +----+-------------+-------+------------+-------+---------------+-----------+---------+------+------+----------+-----------------------+ | id | select_type | table | partitions | type | possible_keys | key | key_len | ref | rows | filtered | Extra | +----+-------------+-------+------------+-------+---------------+-----------+---------+------+------+----------+-----------------------+ | 1 | SIMPLE | t1 | NULL | range | idx_f1_f2 | idx_f1_f2 | 5 | NULL | 8 | 100.00 | Using index condition | +----+-------------+-------+------------+-------+---------------+-----------+---------+------+------+----------+-----------------------+ 1 row in set, 1 warning (0.00 sec) |
If you checked the GitHub link above, you might have noted that the header file only contains three of the counters. This is because icp_attempts is computed as the sum of the rest. As expected, icp_match equals the number of returned rows, which makes sense. icp_no_match should also make sense if we check the amount of rows present without the WHERE conditions on f2.
1 2 3 4 5 6 7 8 9 10 11 12 13 14 | mysql [localhost] {msandbox} (test) > SELECT * FROM t1 WHERE f1 < 3; +------+------+------+ | f1 | f2 | f3 | +------+------+------+ | 1 | 1 | 1 | | 1 | 2 | 1 | | 1 | 3 | 1 | | 1 | 4 | 1 | | 2 | 1 | 1 | | 2 | 2 | 1 | | 2 | 3 | 1 | | 2 | 4 | 1 | +------+------+------+ 8 rows in set (0.00 sec) |
So, 8 – 2 = 6, which is exactly icp_no_match‘s value. Finally, we are left with icp_out_of_range. For each end of range the ICP scan detects, this counter is incremented by one. We only scanned one range in the previous query, so let’s try something more interesting (scanning three ranges):
1 2 3 4 5 6 7 8 9 10 11 12 13 14 15 16 17 18 19 20 21 22 23 24 25 | mysql [localhost] {msandbox} (test) > SET GLOBAL innodb_monitor_reset = module_icp; Query OK, 0 rows affected (0.00 sec) mysql [localhost] {msandbox} (test) > SELECT * FROM t1 WHERE ((f1 < 2) OR (f1 > 4 AND f1 < 6) OR (f1 > 8 AND f1 < 12)) AND (f2 % 4) = 1; +------+------+------+ | f1 | f2 | f3 | +------+------+------+ | 1 | 1 | 1 | | 5 | 1 | 1 | | 9 | 1 | 1 | | 10 | 1 | 1 | | 11 | 1 | 1 | +------+------+------+ 5 rows in set (0.00 sec) mysql [localhost] {msandbox} (test) > SELECT NAME, COUNT_RESET FROM information_schema.INNODB_METRICS WHERE NAME LIKE 'icp%'; +------------------+-------------+ | NAME | COUNT_RESET | +------------------+-------------+ | icp_attempts | 23 | | icp_no_match | 15 | | icp_out_of_range | 3 | | icp_match | 5 | +------------------+-------------+ 4 rows in set (0.01 sec) |
We have now scanned three ranges on f1, namely: (f1 < 2), (4 < f1 < 6) and (8 < f1 < 12). This is correctly reflected in the corresponding counter. Remember that the MariaDB Handler_icp_attempts status counter we looked at in the previous post does not take into account the out-of-range counts. This means the two “attempts” counters will not be the same!
1 2 3 4 5 6 7 8 9 10 11 12 13 14 15 16 17 18 19 20 21 22 | mysql [localhost] {msandbox} (test) > SET GLOBAL innodb_monitor_reset = module_icp; SET GLOBAL innodb_monitor_reset = dml_reads; FLUSH STATUS; ... mysql [localhost] {msandbox} (test) > SELECT * FROM t1 WHERE ((f1 < 2) OR (f1 > 4 AND f1 < 6) OR (f1 > 8 AND f1 < 12)) AND (f2 % 4) = 1; ... 5 rows in set (0.00 sec) mysql [localhost] {msandbox} (test) > SELECT NAME, COUNT_RESET FROM information_schema.INNODB_METRICS WHERE NAME LIKE 'icp_attempts'; +--------------+-------------+ | NAME | COUNT_RESET | +--------------+-------------+ | icp_attempts | 23 | +--------------+-------------+ 1 row in set (0.00 sec) mysql [localhost] {msandbox} (test) > SHOW STATUS LIKE 'Handler_icp_attempts'; +----------------------+-------+ | Variable_name | Value | +----------------------+-------+ | Handler_icp_attempts | 20 | +----------------------+-------+ 1 row in set (0.00 sec) |
It can be a bit confusing to have two counters that supposedly measure the same counts yielding different values, so watch this if you use MariaDB.
ICP Counters in PMM
Today you can find an ICP counters graph for MariaDB (Handler_icp_attempts) in PMM 1.1.3.
Additionally, in release 1.1.4 you’ll find graphs for ICP metrics from information_schema.INNODB_METRICS: just look for the INNODB_METRICS-based graph on the InnoDB Metrics dashboard!
Edit: the graph is available and looks like the following:
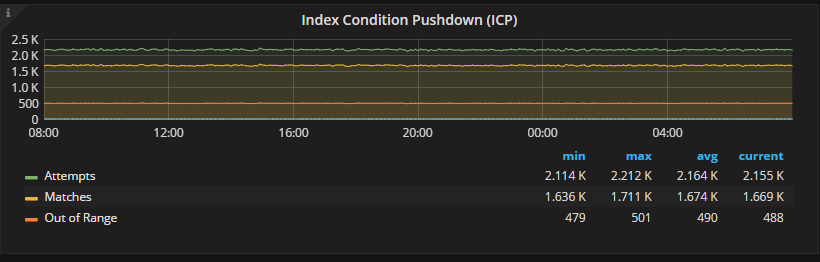
I hope you found this blog post series useful! Let me know if you have any questions or comments below.


