

There can be a lot of confusion and lack of planning in Percona XtraDB Clusters in regards to nodes becoming desynchronized for various reasons. This can happen a few ways:
- An IST or SST joining node catching up after a state transfer (Joined/Joining state)
- Using wsrep_desync for something like a backup
- Executing a rolling-schema-upgrade using using wsrep_OSU_method=RSU
When I say “desynchronized” I mean a node that is permitted to build up a potentially large wsrep_local_recv_queue while some operation is happening. For example a node taking a backup would set wsrep_desync=ON during the backup and potentially fall behind replication some amount.
Some of these operations may completely block Galera from applying transactions, while others may simply increase load on the server enough that it falls behind and applies at a reduced rate.
In all the cases above, flow control is NOT used while the node cannot apply transactions, but it MAY be used while the node is recovering from the operation. For an example of this, see my last blog about IST.
If a cluster is fairly busy, then the flow control that CAN happen when the above operations catch up MAY be detrimental to performance.
Example setup
Let us take my typical 3 node cluster with workload on node1. We are taking a blocking backup of some kind on node3 so we are executing the following steps:
- node3> set global wsrep_desync=ON;
- Node3’s “backup” starts, this starts with FLUSH TABLES WITH READ LOCK;
- Galera is paused on node3 and the wsrep_local_recv_queue grows some amount
- Node3’s “backup” finishes, finishing with UNLOCK TABLES;
- node3> set global wsrep_desync=OFF;
During the backup
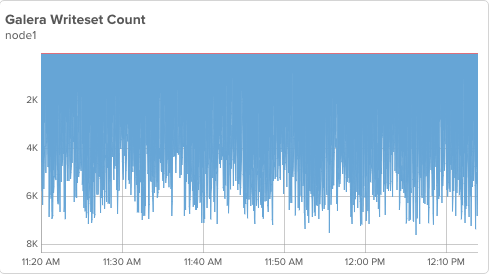
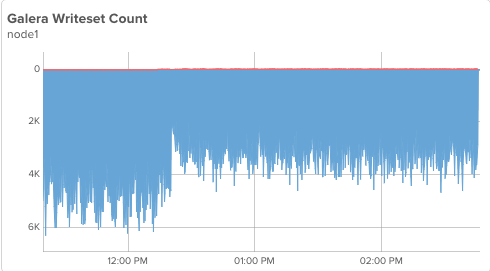
This includes up through step 3 above. My node1 is unaffected by the backup on node3, I can see it averaging 5-6k writesets(transactions) per second which it did before we began:
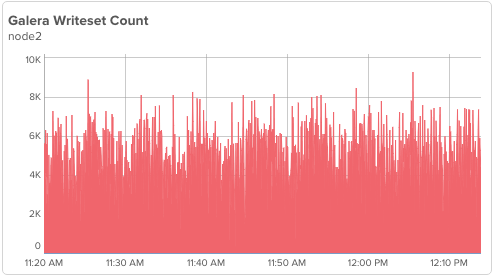
node2 is also unaffected:
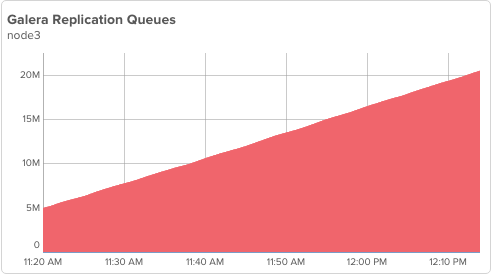
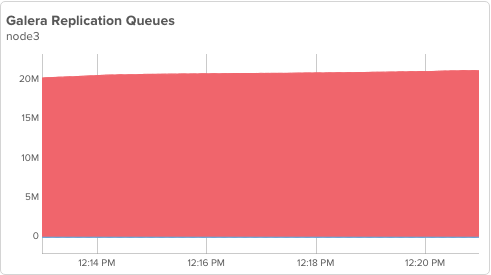
but node3 is not applying and its queue is building up:
Unlock tables, still wsrep_desync=ON
Let’s examine briefly what happens when node3 is permitted to start applying, but wsrep_desync stays enabled:
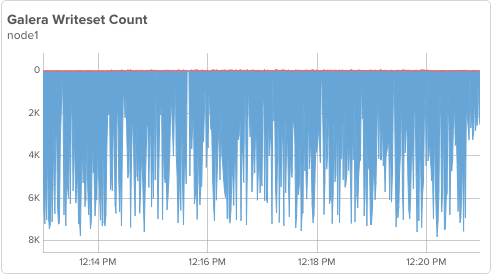
node1’s performance is pretty much the same, node3 is not using flow control yet. However, there is a problem:
It’s hard to notice, but node3 is NOT catching up, instead it is falling further behind! We have potentially created a situation where node3 may never catch up.
The PXC nodes were close enough to the red-line of performance that node3 can only apply just about as fast (and somewhat slower until it heats up a bit) as new transactions are coming into node1.
This represents a serious concern in PXC capacity planning:
Nodes do not only need to be fast enough to handle normal workload, but also to catch up after maintenance operations or failures cause them to fall behind.
Experienced MySQL DBA’s will realize this isn’t all that different than Master/Slave replication.
Flow Control as a way to recovery
So here’s the trick: if we turn off wsrep_desync on node3 now, node3 will use flow control if and only if the incoming replication exceeds node3’s apply rate. This gives node3 a good chance of catching up, but the tradeoff is reducing write throughput of the cluster. Let’s see what this looks like in context with all of our steps. wsrep_desync is turned off at the peak of the replication queue size on node3, around 12:20PM:
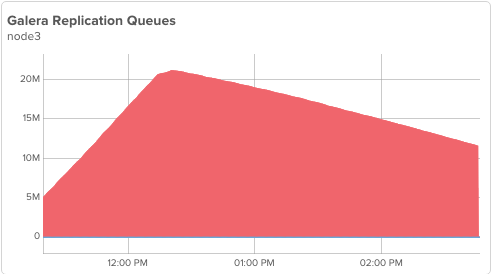
So at the moment node3 starts utilizing flow control to prevent falling further behind, our write throughput (in this specific environment and workload) is reduced by approximately 1/3rd (YMMV). The cluster will remain in this state until node3 catches up and returns to the ‘Synced’ state. This catchup is still happening as I write this post, almost 4 hours after it started and will likely take another hour or two to complete.
I can see a more realtime representation of this by using myq_status on node1, summarizing every minute:
1 2 3 4 5 6 7 8 9 10 11 12 13 14 15 16 | [root@node1 ~]# myq_status -i 1m wsrep mycluster / node1 (idx: 1) / Galera 3.11(ra0189ab) Cluster Node Outbound Inbound FlowC Conflct Gcache Appl time P cnf # stat laten msgs data que msgs data que pause snt lcf bfa ist idx %ef 19:58:47 P 5 3 Sync 0.9ms 3128 2.0M 0 27 213b 0 25.4s 0 0 0 3003k 16k 62% 19:59:47 P 5 3 Sync 1.1ms 3200 2.1M 0 31 248b 0 18.8s 0 0 0 3003k 16k 62% 20:00:47 P 5 3 Sync 0.9ms 3378 2.2M 32 27 217b 0 26.0s 0 0 0 3003k 16k 62% 20:01:47 P 5 3 Sync 0.9ms 3662 2.4M 32 33 266b 0 18.9s 0 0 0 3003k 16k 62% 20:02:47 P 5 3 Sync 0.9ms 3340 2.2M 32 27 215b 0 27.2s 0 0 0 3003k 16k 62% 20:03:47 P 5 3 Sync 0.9ms 3193 2.1M 0 27 215b 0 25.6s 0 0 0 3003k 16k 62% 20:04:47 P 5 3 Sync 0.9ms 3009 1.9M 12 28 224b 0 22.8s 0 0 0 3003k 16k 62% 20:05:47 P 5 3 Sync 0.9ms 3437 2.2M 0 27 218b 0 23.9s 0 0 0 3003k 16k 62% 20:06:47 P 5 3 Sync 0.9ms 3319 2.1M 7 28 220b 0 24.2s 0 0 0 3003k 16k 62% 20:07:47 P 5 3 Sync 1.0ms 3388 2.2M 16 31 251b 0 22.6s 0 0 0 3003k 16k 62% 20:08:47 P 5 3 Sync 1.1ms 3695 2.4M 19 39 312b 0 13.9s 0 0 0 3003k 16k 62% 20:09:47 P 5 3 Sync 0.9ms 3293 2.1M 0 26 211b 0 26.2s 0 0 0 3003k 16k 62% |
This reports around 20-25 seconds of flow control every minute, which is consistent with that ~1/3rd of performance reduction we see in the graphs above.
Watching node3 the same way proves it is sending the flow control (FlowC snt):
1 2 3 4 5 6 7 8 9 10 11 12 13 | mycluster / node3 (idx: 2) / Galera 3.11(ra0189ab) Cluster Node Outbound Inbound FlowC Conflct Gcache Appl time P cnf # stat laten msgs data que msgs data que pause snt lcf bfa ist idx %ef 17:38:09 P 5 3 Dono 0.8ms 0 0b 0 4434 2.8M 16m 25.2s 31 0 0 18634 16k 80% 17:39:09 P 5 3 Dono 1.3ms 0 0b 1 5040 3.2M 16m 22.1s 29 0 0 37497 16k 80% 17:40:09 P 5 3 Dono 1.4ms 0 0b 0 4506 2.9M 16m 21.0s 31 0 0 16674 16k 80% 17:41:09 P 5 3 Dono 0.9ms 0 0b 0 5274 3.4M 16m 16.4s 27 0 0 22134 16k 80% 17:42:09 P 5 3 Dono 0.9ms 0 0b 0 4826 3.1M 16m 19.8s 26 0 0 16386 16k 80% 17:43:09 P 5 3 Jned 0.9ms 0 0b 0 4957 3.2M 16m 18.7s 28 0 0 83677 16k 80% 17:44:09 P 5 3 Jned 0.9ms 0 0b 0 3693 2.4M 16m 27.2s 30 0 0 131k 16k 80% 17:45:09 P 5 3 Jned 0.9ms 0 0b 0 4151 2.7M 16m 26.3s 34 0 0 185k 16k 80% 17:46:09 P 5 3 Jned 1.5ms 0 0b 0 4420 2.8M 16m 25.0s 30 0 0 245k 16k 80% 17:47:09 P 5 3 Jned 1.3ms 0 0b 1 4806 3.1M 16m 21.0s 27 0 0 310k 16k 80% |
There are a lot of flow control messages (around 30) per minute. This is a lot of ON/OFF toggles of flow control where writes are briefly delayed rather than a steady “you can’t write” for 20 seconds straight.
It also interestingly spends a long time in the Donor/Desynced state (even though wsrep_desync was turned OFF hours before) and then moves to the Joined state (this has the same meaning as during an IST).
Does it matter?
As always, it depends.
If these are web requests and suddenly the database can only handle ~66% of the traffic, that’s likely a problem, but maybe it just slows down the website somewhat. I want to emphasize that WRITES are what is affected here. Reads on any and all nodes should be normal (though you probably don’t want to read from node3 since it is so far behind).
If this were some queue processing that had reduced throughput, I’d expect it to possibly catch up later
This can only be answered for your application, but the takeaways for me are:
- Don’t underestimate your capacity requirements
- Being at the redline normally means you are well past the redline for abnormal events.
- Plan for maintenance and failure recoveries
- Where possible, build queuing into your workflows so diminished throughput in your architecture doesn’t generate failures.
Happy clustering!
Graphs in this post courtesy of VividCortex.


Nice blog, I think it is important to understand importance of gcache size, if node is desynchronized for a long time and if gcache size is small to contain the pending writesets and to allow IST after the DDL/Backup job is over.