

 If you’re building custom dashboards for Percona Monitoring and Management (PMM), chances are you would like to use Prometheus recording rules for better performance.
In the nutshell, recording rules act somewhat as materialized views in relational databases, pre-computing and storing results of complicated queries, to limit data crunching needed during dashboard load.
As an example, let’s use a common “problematic” data point – CPU usage. With Linux exposing some 10 CPU usage “modes” data points for every CPU logical core, for powerful systems we may be pushing 1000 data points every scrape interval, meaning lots of data crunching when trending CPU usage even for a few hours.
Instead, we can compute how many “CPU Cores” are used on average with one-minute resolution and use it for high-performance long term trending.
To do this we can define the rule as follows:
1 2 3 4 5 6 | groups: - name: cpu.rules interval: 1m rules: - expr: sum(rate(node_cpu_seconds_total{mode!="idle",mode!="iowait",mode!="steal"}[1m])) by (node_name) record: node:cpu_usage_seconds_total:sum_rate_1m |
This means, run an evaluation of the named rule every 1 minute and store the result as “node:cpu_usage_seconds_total:sum_rate_1m” time series. Because the sum by (node_name) is the only label that will be retained, the rest of the labels are dropped.
Ok. Now we have got such a custom recording rule; how do we enable it in PMM?
The easiest way is to go to PMM Settings and paste the file to the PMM Settings Alertmanager Integration Configuration:

I know the interface does not say so (as of PMM 2.12), but it really does accept recording rules NOT just alerting rules in this interface (although it may not work forever this way, it does now!).
You can also use the API (Documented Though Swagger) to supply Recording Rules configuration to PMM – Check out the /v1/Settings/Change method.
Web Interface (and API) are smart enough to check your recording/alerting rules for syntax and if there is a syntax error, changes will not be applied.

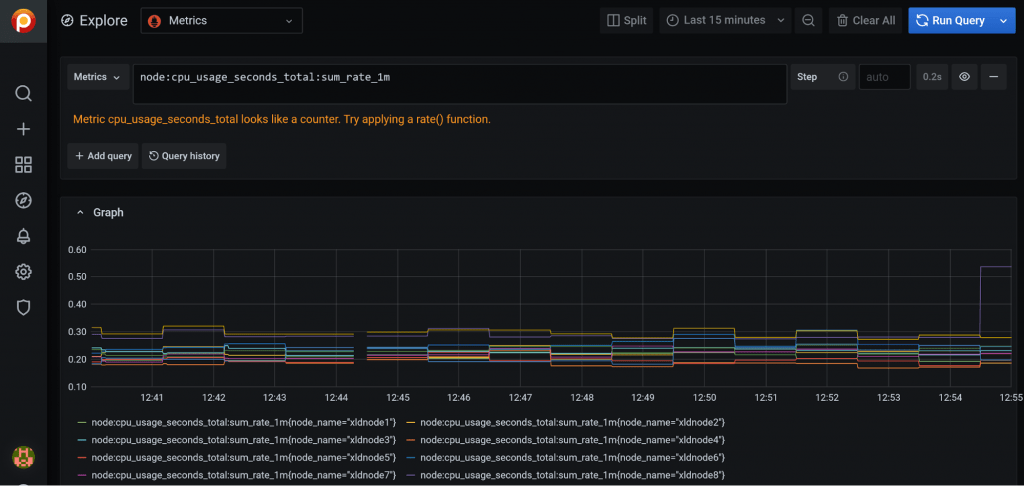
Now that we have set up our recording rule we can see values being recorded through the Explore Interface:
Going Off the Deep End
Most of you should stop reading right here and go get the recording rules you need in place. For the curious minority, though, let’s look under the covers and check out some additional implementation details.
Note: These details correspond to Percona Monitoring and Management 2.12 which includes VictoriaMetrics. Previous releases and possibly future releases can change details of implementation without notice.
If you’re running PMM as Docker Container you can enter the container through this command:
1 | root@PMM2Server:~# docker exec -it pmm-server bash |
For other deployment types, connect to the Virtual Appliance through ssh:
1 2 3 4 5 6 7 8 9 10 | [root@641c08864858 opt]# cd /srv/prometheus/rules/ [root@641c08864858 rules]# ls pmm.rules.yml [root@641c08864858 rules]# cat pmm.rules.yml groups: - name: cpu.rules interval: 1m rules: - expr: sum(rate(node_cpu_seconds_total{mode!="idle",mode!="iowait",mode!="steal"}[1m])) by (node_name) record: node:cpu_usage_seconds_total:sum_rate_1m |
As you can see. the contents we passed through the API got stored in the pmm.rules.yml file.
With VictoriaMetrics, rules processing is done by the VmAlert tool which supports most of Prometheus Alerting syntax (of course, using slightly different language MetricsQL rather than PromQL for expressions), though in most cases you will not see the difference.
1 2 | [root@641c08864858 rules]# ps aux | grep vmalert pmm 18 0.0 0.6 712180 6652 ? Sl Dec06 5:43 /usr/sbin/vmalert --notifier.url=http://127.0.0.1:9093/alertmanager --notifier.basicAuth.password= --notifier.basicAuth.username= --external.url=http://localhost:9090/prometheus --datasource.url=http://127.0.0.1:9090/prometheus --remoteRead.url=http://127.0.0.1:9090/prometheus --remoteWrite.url=http://127.0.0.1:9090/prometheus --rule=/srv/prometheus/rules/*.yml --httpListenAddr=127.0.0.1:8880 |
As you may guess from this configuration /srv/prometheus/rules/*.yml are used as a source of rules, so you can add your own files to this directory too… though we would rather have you use the API (or Web Interface) instead.
You also may discover there is VMAlert API which can be rather helpful for troubleshooting.
For example, you can get the Recording Rules Groups Status this way:
1 2 | [root@641c08864858 rules]# curl http://127.0.0.1:8880/api/v1/groups {"data":{"groups":[{"name":"cpu.rules","id":"10366635785632970132","file":"/srv/prometheus/rules/pmm.rules.yml","interval":"1m0s","concurrency":1,"alerting_rules":null,"recording_rules":[{"id":"2245083066170751034","name":"node:cpu_usage_seconds_total:sum_rate_1m","group_id":"10366635785632970132","expression":"sum(rate(node_cpu_seconds_total{mode!=\"idle\",mode!=\"iowait\",mode!=\"steal\"}[1m])) by (node_name)","last_error":"","last_exec":"2020-12-11T18:13:29.695994753Z","labels":null}]}]},"status":"success"} |
Which shows what rules have been loaded and if they are executing successfully. This particular access point is also mapped to the http://<PMMSERVER>/prometheus/rules URL to make it easily externally accessible.
This should get you going with Percona Monitoring and Management (PMM) and recording rules, and if you need more help, feel free to ask a question on our forums!


