

In this article, we’ll describe how to collect PostgreSQL metrics with Percona Monitoring and Management (PMM).
We designed Percona Monitoring and Management (PMM) to be the best tool for MySQL and MongoDB performance investigation. At the same time, it’s built on mature opensource components: Prometheus’ time series database and Grafana. Starting from PMM 1.4.0. it’s possible to add monitoring for any service supported by Prometheus.
Curious about Percona Monitoring and Management but haven’t tried it yet? Get started here!
Demo
1 2 3 4 5 | # install docker and docker-compose. git clone https://github.com/ihanick/pmm-postgresql-demo.git cd pmm-postgresql-demo docker-compose build docker-compose up |
At this point, we are running exporter, PostgreSQL and the PMM server, but pmm-client on the PostgreSQL server isn’t configured.
1 | docker-compose exec pg sh /root/initpmm.sh |
Now we configured pmm client and added external exporter.
Let’s assume that you have executed commands above on the localhost. At this point we have several URLs:
- External exporter for PostgreSQL output: http://localhost:9187/metrics.
- PMM GUI based on Grafana: http://localhost:8080/graph/
We also need to create graphs for our new exporter. This could be done manually (import JSON), or you can import the existing dashboard Postgres_exporter published in the Grafana gallery by number in the catalog:
- Go to your PMM server web interface and press on the Grafana icon at the top left corner, then dashboards, the import.
- Copy and paste the dashboard ID from the Grafana site to “Grafana.com Dashboard” field, and press load.
- In the next dialog, choose Prometheus as a data source and continue.
PostgreSQL performance graphs can be seen at: http://localhost:8080/graph/dashboard/db/postgres_exporter?orgId=1
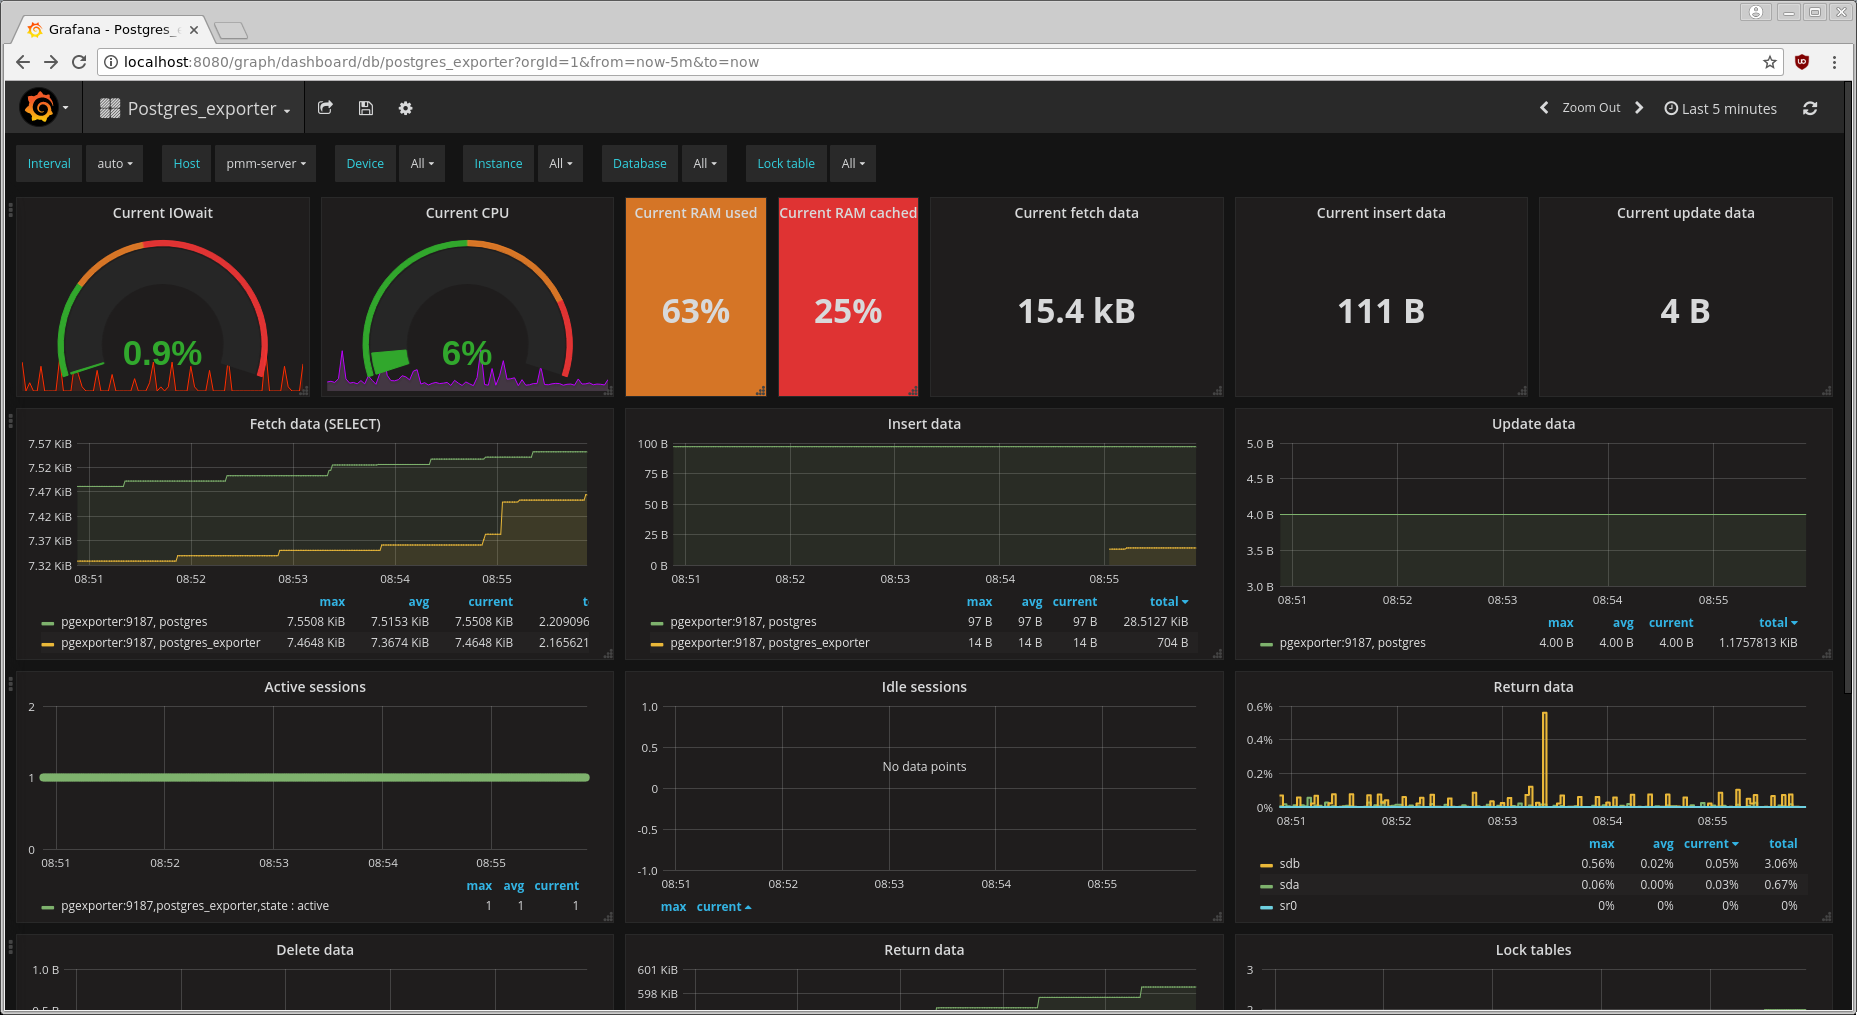
PMM PostgreSQL postgres_exporter template
PMM-PostgreSQL Demo Under the Hood
To move this configuration to production, we need to understand how this demo works.
PMM Server
First of all, you need an existing PMM Server. You can find details on new server configuration at Deploying Percona Monitoring and Management.
In my demo I’m starting PMM without volumes, and all metrics dropped after using the docker-compose down command. Also, there is no need to use port 8080 for PMM, set it up with SSL support and password in production.
PostgreSQL Setup
I’m modifying the latest default PostgreSQL image to:
- Create monitoring user with restricted permissions
- Inside postgres_exporter database, create a view for pg_stat_activity and pg_stat_replication
- Install the PMM client from Percona’s apt repository
- Copy the script for the PMM client configuration to simplify setup
Of course, you can use a dedicated PostgreSQL server instead of one running inside a docker-compose sandbox. The only requirement is that the PMM server should be able to connect to this server.
User creation and permissions:
1 2 3 4 5 6 7 8 9 10 11 12 13 14 15 16 17 18 | CREATE DATABASE postgres_exporter; CREATE USER postgres_exporter PASSWORD 'password'; ALTER USER postgres_exporter SET SEARCH_PATH TO postgres_exporter,pg_catalog; -- If deploying as non-superuser (for example in AWS RDS) -- GRANT postgres_exporter TO :MASTER_USER; CREATE SCHEMA postgres_exporter AUTHORIZATION postgres_exporter; CREATE VIEW postgres_exporter.pg_stat_activity AS SELECT * from pg_catalog.pg_stat_activity; GRANT SELECT ON postgres_exporter.pg_stat_activity TO postgres_exporter; CREATE VIEW postgres_exporter.pg_stat_replication AS SELECT * from pg_catalog.pg_stat_replication; GRANT SELECT ON postgres_exporter.pg_stat_replication TO postgres_exporter; |
To simplify setup, you can use a superuser account and access pg_catalog directly. To improve security, allow this user to connect only from exporter host.
PMM Client Setup on PostgreSQL Host
You can obtain database-only statistics with just the external exporter, and you can use any host with pmm-client installed. Fortunately, you can also export Linux metrics from the database host.
After installing the pmm-client package, you still need to configure the system. We should point it to the PMM server and register the external exporter (and optionally add the linux:metrics exporter).
1 2 3 4 5 6 7 | #!/bin/sh pmm-admin config --client-name pg1 --server pmm-server pmm-admin add external:metrics postgresql pgexporter:9187 # optional pmm-admin add linux:metrics # other postgresql instances pmm-admin add external:instances postgresql 172.18.0.3:9187 |
It’s important to keep the external exporter job name as “postgresql”, since all existing templates check it. There is a bit of inconsistency here: the first postgresql server is added as external:metrics, but all further servers should be added as external:instances.
The reason is the first command creates the Prometheus job and first instance, and further servers can be added without job creation.
PMM 1.7.0 external:service
Starting from PMM 1.7.0 the setup simplified if exporter located on the same host as pmm-client:
1 2 | pmm-admin config --client-name pg1 --server pmm-server pmm-admin add external:service --service-port=9187 postgresql |
pmm-admin add external:metrics or pmm-admin add external:instances are not required if you are running exporter on the same host as pmm-client.
Exporter Setup
Exporter is a simple HTTP/HTTPS server returning one page. The format is:
1 2 3 4 | curl -si http://172.17.0.4:9187/metrics|grep pg_static # HELP pg_static Version string as reported by postgres # TYPE pg_static untyped pg_static{short_version="10.1.0",version="PostgreSQL 10.1 on x86_64-pc-linux-gnu, compiled by gcc (Debian 6.3.0-18) 6.3.0 20170516, 64-bit"} 1 |
As you can see, it’s a self-describing set of counters and string values. The Prometheus time series database built-in to PMM connects to the web server and stores the results on disk. There are multiple exporters available for PostgreSQL. postgres_exporter is listed as a third-party on the official Prometheus website.
You can compile exporter by yourself, or run it inside docker container. This and many other exporters are written in Go and compiled as a static binary so that you can copy the executable from the host with same CPU architecture. For production setups, you probably will run exporter from a database host directly and start the service with systemd.
In order to check network configuration issues, login to pmm-server and use the curl command from above. Do not forget to replace 172.17.0.4:9187 with the appropriate host:port (use the same IP address or DNS name as the pmm-admin add command).
You configure postgres_exporter with a single environment variable:
1 | DATA_SOURCE_NAME=postgresql://postgres_exporter:password@pg:5432/postgres_exporter?sslmode=disable |
Make sure that you provide the correct credentials, including the database name.
Run external exporter directly on database server
In order to simplify production setup, you can run exporter directly from the same server as you are using for running PostgreSQL.
This method allows you to use pmm-admin add external:service command recently added to PMM.
1 2 3 4 5 6 7 8 | # Copy exporter binary from docker container to the local directory to skip build from sources docker cp pmmpostgres_pgexporter_1:/postgres_exporter ./ # copy exporter binary to database host, use scp instead for existing database server. docker cp postgres_exporter pmmpostgres_pg_1:/root/ # login to database server shell docker exec -it pmmpostgres_pg_1 bash # start exporter DATA_SOURCE_NAME='postgresql://postgres_exporter:[email protected]:5432/postgres_exporter?sslmode=disable' ./postgres_exporter |
Grafana Setup
In the demo, I’ve used Postgres_exporter dashboard. Use the same site and look for other PostgreSQL dashboards if you need more. The exporter provides many parameters, and not all of them are visualized in this dashboard.
For huge installations, you may find that filtering servers by “instance name” is not comfortable. Write your own JSON for the dashboard, or try to use one from demo repository. It’s the same as dashboard 3742, but uses the hostname for filtering and Prometheus job name in the legends.
All entries of instance=~"$instance" get replaced with instance=~"$host:.*".
The modification allows you to switch between PostgreSQL servers with host instead of “instance”, and see CPU and disk details for the current database server instead of the previously selected host.
Notice
This blog post on how to collect PostgreSQL metrics with Percona Monitoring and Management is not an official integration of PostgreSQL and PMM. I’ve tried to describe complex external exporters setup. Instead of PostgreSQL, you can use any other services and exporters with a similar setup, or even create your own exporter and instrument your application. It’s a great thing to see correlations between application activities and other system components like databases, web servers, etc.
Want to learn more about optimizing your PostgreSQL performance with Percona Monitoring and Management (PMM)? This on-demand webinar, led by PostgreSQL experts will guide you through setting up and maximizing PMM for your PostgreSQL deployments. Learn how to customize metrics and dashboards, as well as gain skills in troubleshooting and root cause analysis.


[root@vm pmm-postgresql-demo]# docker-compose exec pg sh /root/initpmm.sh
OK, PMM server is alive.
PMM Server | pmm-server
Client Name | pg1
Client Address | 172.28.0.3
Error adding external metrics: scrape config with job name “postgresql” is built-in
Hi Dmitry,
Nowadays you can setup postgresql monitoring with built-in Dashboards and support in pmm-admin client package:
https://www.percona.com/doc/percona-monitoring-and-management/conf-postgres.html
This article should be used only if you need an example for external exporters, e.g. to instrument your application or add a support for rarely used database engine.