

In this post, we’ll examine how we’ve improved the GUI layout for Percona Monitoring and Management 1.5 by moving the Query Analytics (QAN) functions into the Grafana interface.
For Percona Monitoring and Management users, you might notice that QAN appears a little differently in our 1.5 release. We’ve taken steps to unify the PMM interface so that it feels more natural to move from reviewing historical trends in Metrics Monitor to examining slow queries in QAN. Most significantly:
- QAN moves from a stand-alone application into Metrics Monitor as a dashboard application
- We updated the color scheme of QAN to match Metrics Monitor (but you can toggle a button if you prefer to still see QAN in white!)
- Date picker and host selector now use the same methods as Metrics Monitor

Starting from the PMM landing page, you still see two buttons – one for Metrics Monitor and another for Query Analytics (this hasn’t changed):

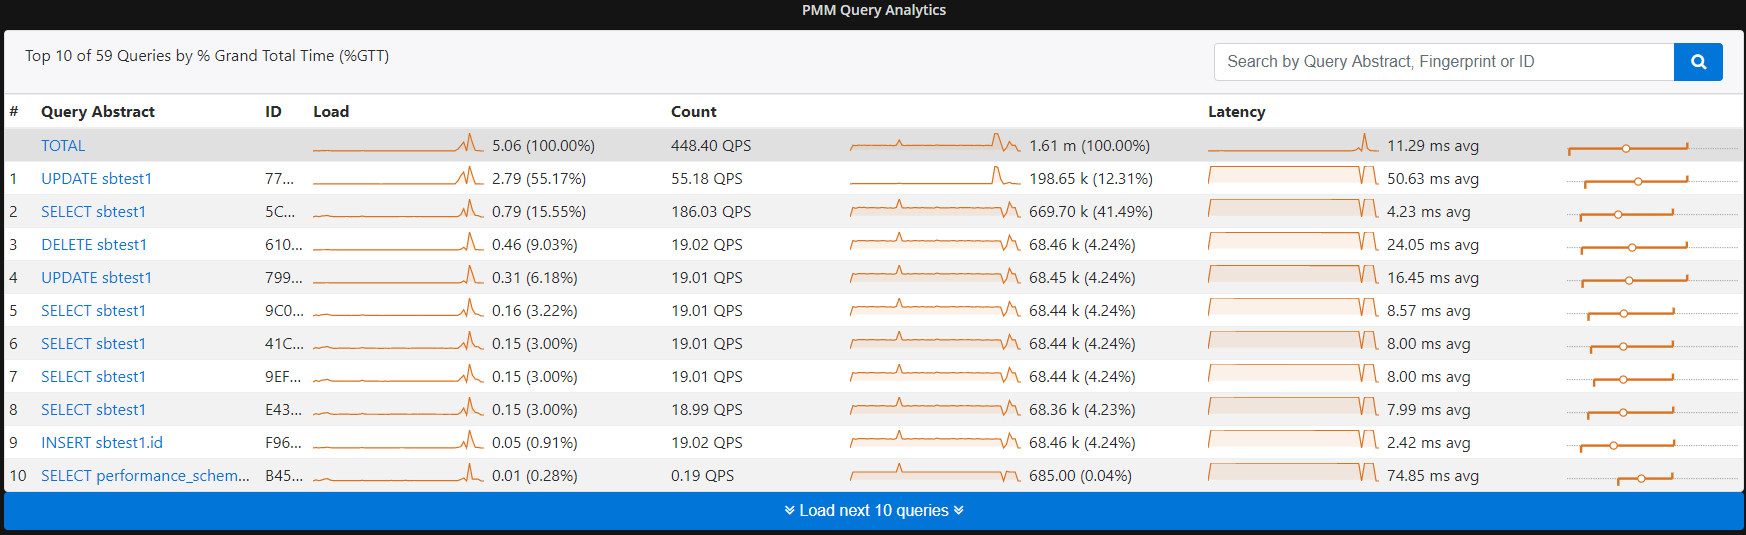
Once you select Query Analytics on the left, you see the new Metrics Monitor dashboard page for PMM Query Analytics. It is now hosted as a Metrics Monitor dashboard, and notice the URL is no longer /qan:

Another advantage of the Metrics Monitor dashboard integration is that the QAN inherits the host selector from Grafana, which supports partial string matching. This makes it simpler to find the host you’re searching for if you have more than a handful of instances:

The last feature enhancement worth mentioning is the native Grafana time selector, which lets you select down to the minute resolution time frames. This was a frequent source of feature requests — previously PMM limited you to our pre-defined default ranges. Keep in mind that QAN has an internal archiving job that caps QAN history at eight days.

Last but not least is the ability to toggle between the default dark interface and the optional white. Look for the small lightbulb icon at the bottom left of any QAN screen (![]() ) and give it a try!
) and give it a try!
We hope you enjoy the new interface, and we look forward to your feedback on these improvements!


