

Introduction
When people think about Percona’s microslow patch immediately a question arises how much logging impacts on performance. When we do performance audit often we log every query to find not only slow queries. A query may take less than a second to execute, but a huge number of such queries may significantly load a server. On one hand logging causes sequential writes which can’t impair performance much, on other hand when every query is logged there is a plenty of write operations and obviously performance suffers. Let’s investigate how much.
I took DBT2, an OSDL’s implementation of TPC-C.
Hardware used
The benchmark was run on a DELL server running CentOS release 4.7 (Final)
There are four CPUs Intel(R) Xeon(R) CPU 5150 @ 2.66GHz, 32GB RAM. There are 8 disks in RAID10(a mirror of 4+4 striped disks).
Software
It was used MySQL 5.0.75-percona-b11 on CentOS release 4.7
MySQL setting
There were two cases considered CPU- and IO-bound.
Each case had three options:
- logging turned off;
- logging queries which take more than a second to execute;
- logging every query;
MySQL was run with default settings except following:
1 2 3 4 5 6 7 | [mysqld] user=root max_connections=3000 innodb_log_file_size=128M innodb_flush_log_at_trx_commit=1 innodb_file_per_table table_cache=2000 |
Depending on workload different InnoDB buffer was used.
In CPU-bound case
1 | innodb_buffer_pool_size=2G |
In IO-bound case
1 2 | innodb_buffer_pool_size=512M innodb_flush_method=O_DIRECT |
DBT2 settings
For CPU-bound case number of warehouses was 10(1.31GiB). In case of IO-bound load – 100 warehouses which is 10GiB in terms of database size.
The test was run with 1, 20 and 100 database connections
Results
To reduce random error the test was run 3 times per each parameter set.
The metric of a DBT2 test is NOTPM (New Order Transaction per Minute) – the more the better.
CPU-bound case – 10 warehouses
| # of connections | No logging, NOTPM | Logging queries >1 SEC, NOTPM | ratio 1 sec / no_logging | Logging all queries, NOTPM | Ratio all_logging / no_logging |
| 1 | 9607 | 9632 | 1.00 | 8434 | 0.88 |
| 20 | 27612 | 27720 | 1.00 | 22105 | 0.80 |
| 100 | 11704 | 11741 | 1.00 | 10956 | 0.94 |
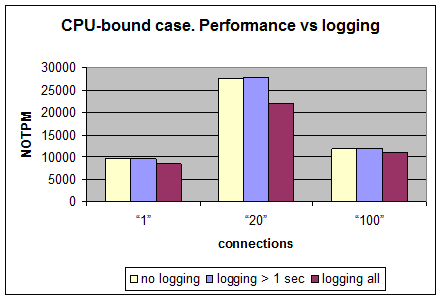
We see here that logging all queries decreases MySQL’s performance on 6-20% depending on a number of connections to a database.
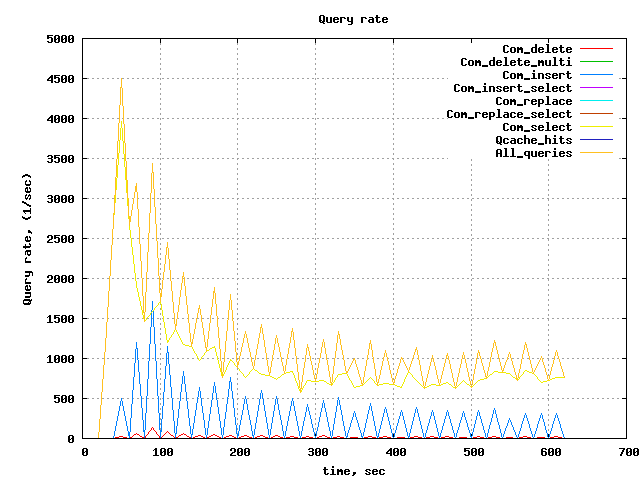
It should be noted during the test it was executed roughly 20-25k queries per second. If all queries are logged – a slow log is populated at rate about 10MB/sec. This is the highest rate observed.
IO-bound case – 100 warehouses
| # of connections | No logging, NOTPM | Logging queries > 1 sec, NOTPM | Ratio no_logging / 1 sec_logging | Logging all, NOTPM | Ratio no_logging / all_logging |
| 1 | 225 ± 9 | 211 ± 3 | 0.94 | 213 ± 9 | 0.95 |
| 20 | 767 ± 41 | 730 ± 35 | 0.95 | 751 ± 33 | 0.98 |
| 100 | 746 ± 54 | 731 ± 12 | 0.98 | 703 ± 36 | 0.94 |
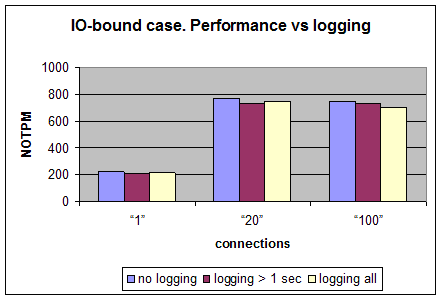
In this case every test was run 5 times and random measurement error was calculated. As it is seen from the chart above the performance almost doesn’t depend on logging – the difference doesn’t exceed the measurement error.
The query rate in this case is about 1000 per second.
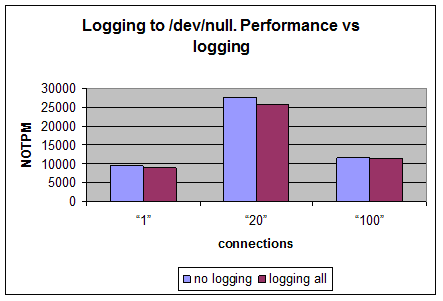
Logging to /dev/null
It is interesting to know how much from performance degradation caused by the microslow patch itself. Let’s do the same tests but logging to /dev/null.
| # of connections | No logging, NOTPM | Logging all queries, NOTPM | Ratio all_logging /no_logging |
| 1 | 9512 | 8943 | 0.94 |
| 20 | 27675 | 25869 | 0.93 |
| 100 | 11609 | 11236 | 0.97 |
Conclusion
From the all tests above there are two conclusions can be made:
- It is safe to log slow queries with execution time bigger than a second without worry about performance impact in case of CPU-bound workload. The performance impact is negligibly small in IO-bound workload even if all queries are logged.
- In general logging all queries can hurt MySQL and you should consider the load while using it, especially in CPU-bound case.


So nothing new really, but good to have the numbers. Thanks!
Arjen,
Exactly — and as has been pointed out over and over, the minute you propose to people the means to figure out where their performance problems are, the first thing they do is anxiously ask “how much overhead does it have.” Look at the PostgreSQL blogging world’s take on this last week:
http://carymillsap.blogspot.com/2009/02/on-usefulness-of-software.html
http://prodlife.wordpress.com/2009/02/04/psychology-of-instrumentation/
http://tkyte.blogspot.com/2005/06/instrumentation.html
I think this benchmark shows that a) in cases where you’re I/O bound, which is exactly the time when people worry about the impact of logging, it isn’t measurable, and b) it’s not that much overhead anyway.
Interesting your point to Cary Millsap blog.
I think his Book on Oracle Performance Optimization is one of the best books on performance tuning. It surely taught me a lot when… And a lot of principles are general being it Oracle or MySQL just tools (or lack of tools) is different.
What about logging queries like INSERT INTO binary_table VALUES (123, ‘%LARGE_BINARY_BLOB%’)?
I’ve found some time ago that for PostgreSQL logging such queries takes more time (and uses a lot of CPU) than this insert executes.
This whole topic is one of the reason’s we’ve always been so excited about dtrace. I wonder, perhaps you guys should query the mysql developers to get a copy of their dtrace probes patch for 6.0, and put it into OurDelta now. Probes are pretty non-intrusive; we’ve done them for both Apache and Postgres on our own (though we worked with Sun to get the Postgres ones into core for Postgres 8.4).
http://labs.omniti.com/trac/project-dtrace/wiki
http://lethargy.org/~jesus/index.php?serendipity%5Baction%5D=search&serendipity%5BsearchTerm%5D=dtrace&serendipity%5BsearchButton%5D=%3E
Robert,
Dtrace is cool. The thing is though very little of our customers runs Solaris. I worked w Sun on Dtrace support for MySQL during my time there.
The whole question is a non-issue. Turn on the slowlog, and leave it on. Why do I say that?
* If the system is performing well, then, by definition, the slowlog is not hurting.
* If the system is performing poorly, then you need to look back at what was causing the most pain and fix it. And the slowlog is the best way to do that.
We have hundreds of systems (thousands of servers in replication setups) in production. The default is to have the slowlog on, and to set long_query_time = 2. (Some systems use higher or lower values.)
When there is a meltdown, the slowlog is sometimes the best source of ‘why’. The rest of the time, I find it useful to proactively look for naughty queries and propose tuning / index / schema / design changes.
Anyway, thanks for confirming that the overhead is “in the noise”. (I assume you are talking only about the slowlog, not the binlog, nor the general log.)
Slow Query should be run on as-needed basis, and re-actively not pro-actively. I’ve actually see worse performance caused by slow query turned on, especially for very large (but not necessarily slow) queries.
It’s a good tool but it should only be used when needed, and that’s why it’s turned off by default.
This post is over 6 years old, I bet MySQL and Percona have changed alot since then to make these numbers obsolete.
Is there a more recent look at audit logging overheads anywhere?